

Question: Require experts help in detail with below three questions. Please refer to images as well W AutoSave On ps2_24_word Saved Search File Home Insert Draw
Require experts help in detail with below three questions. Please refer to images as well
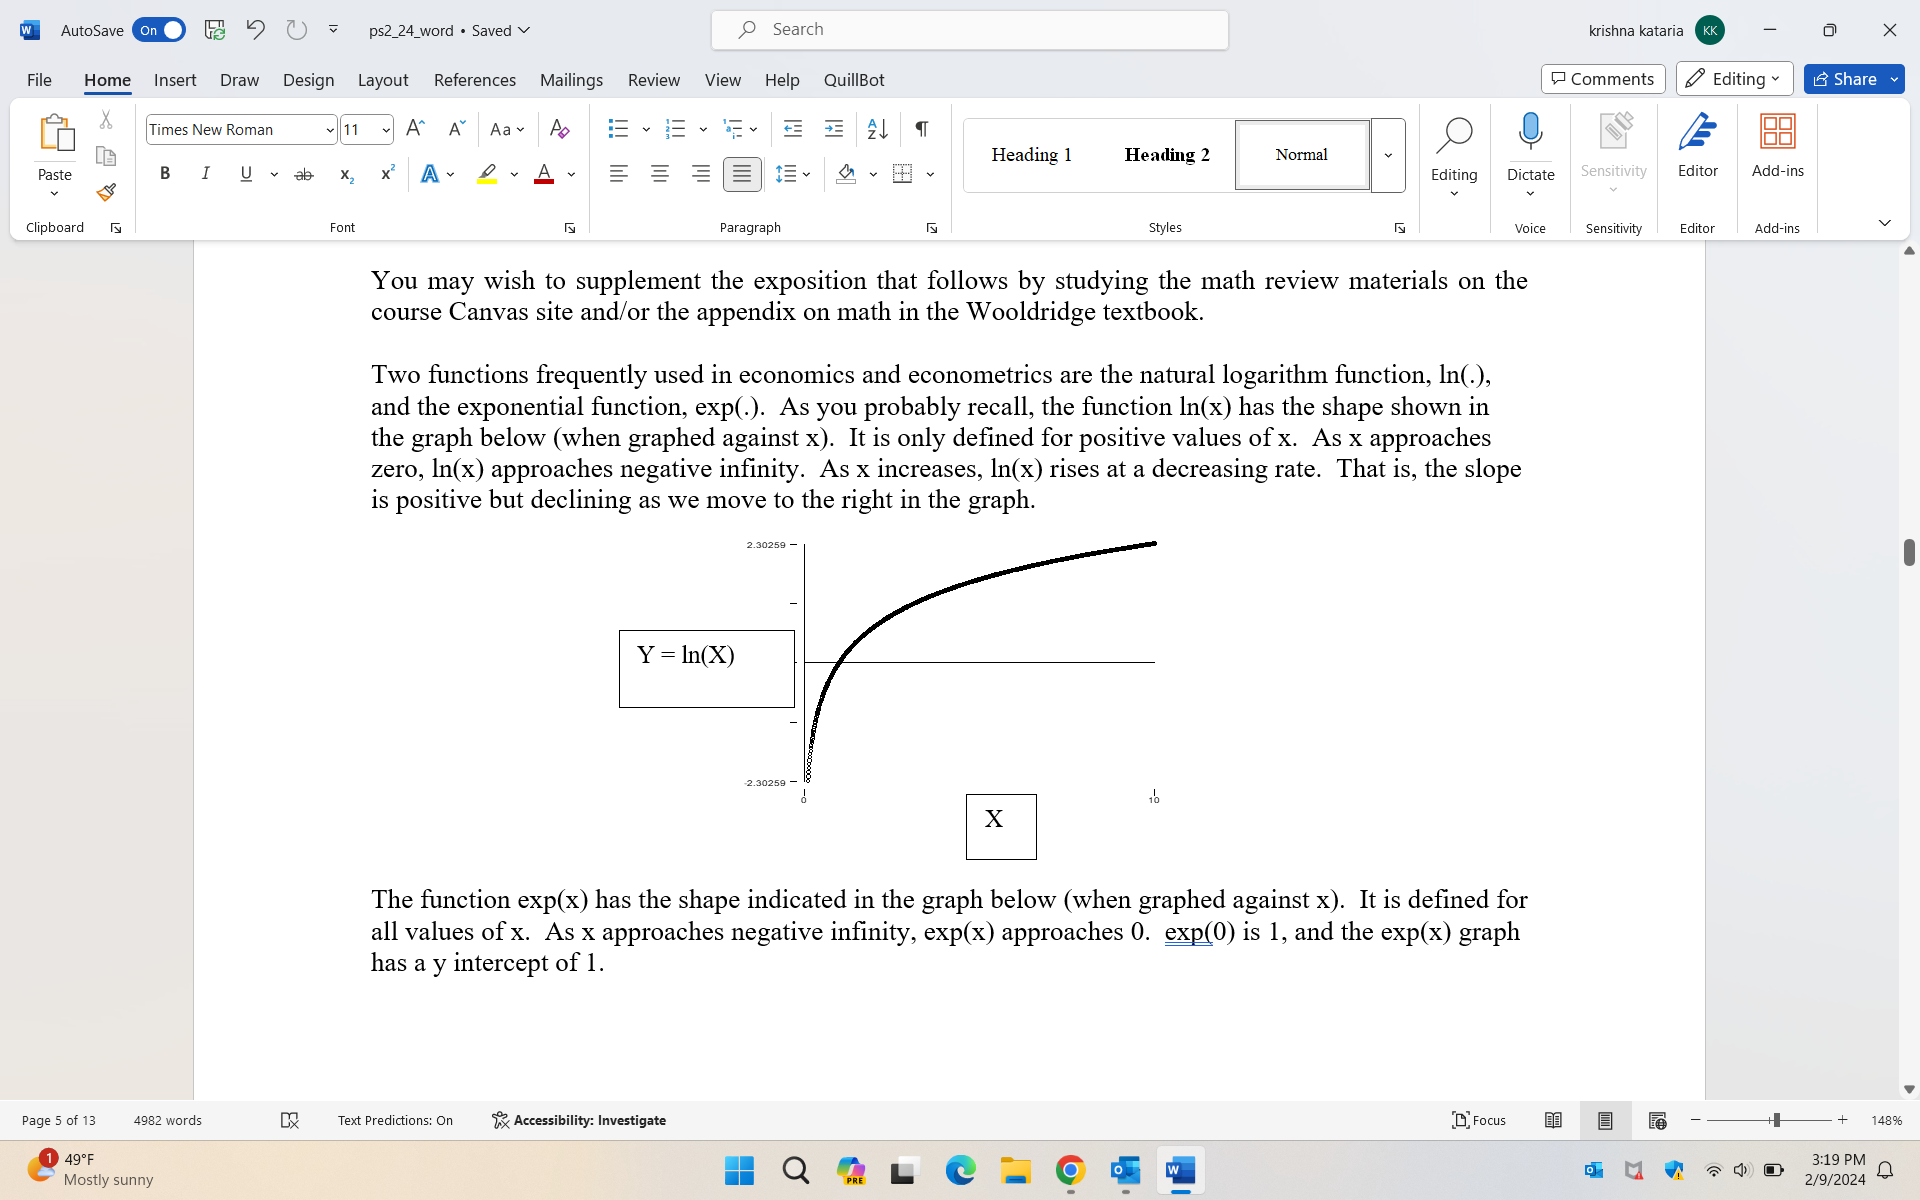
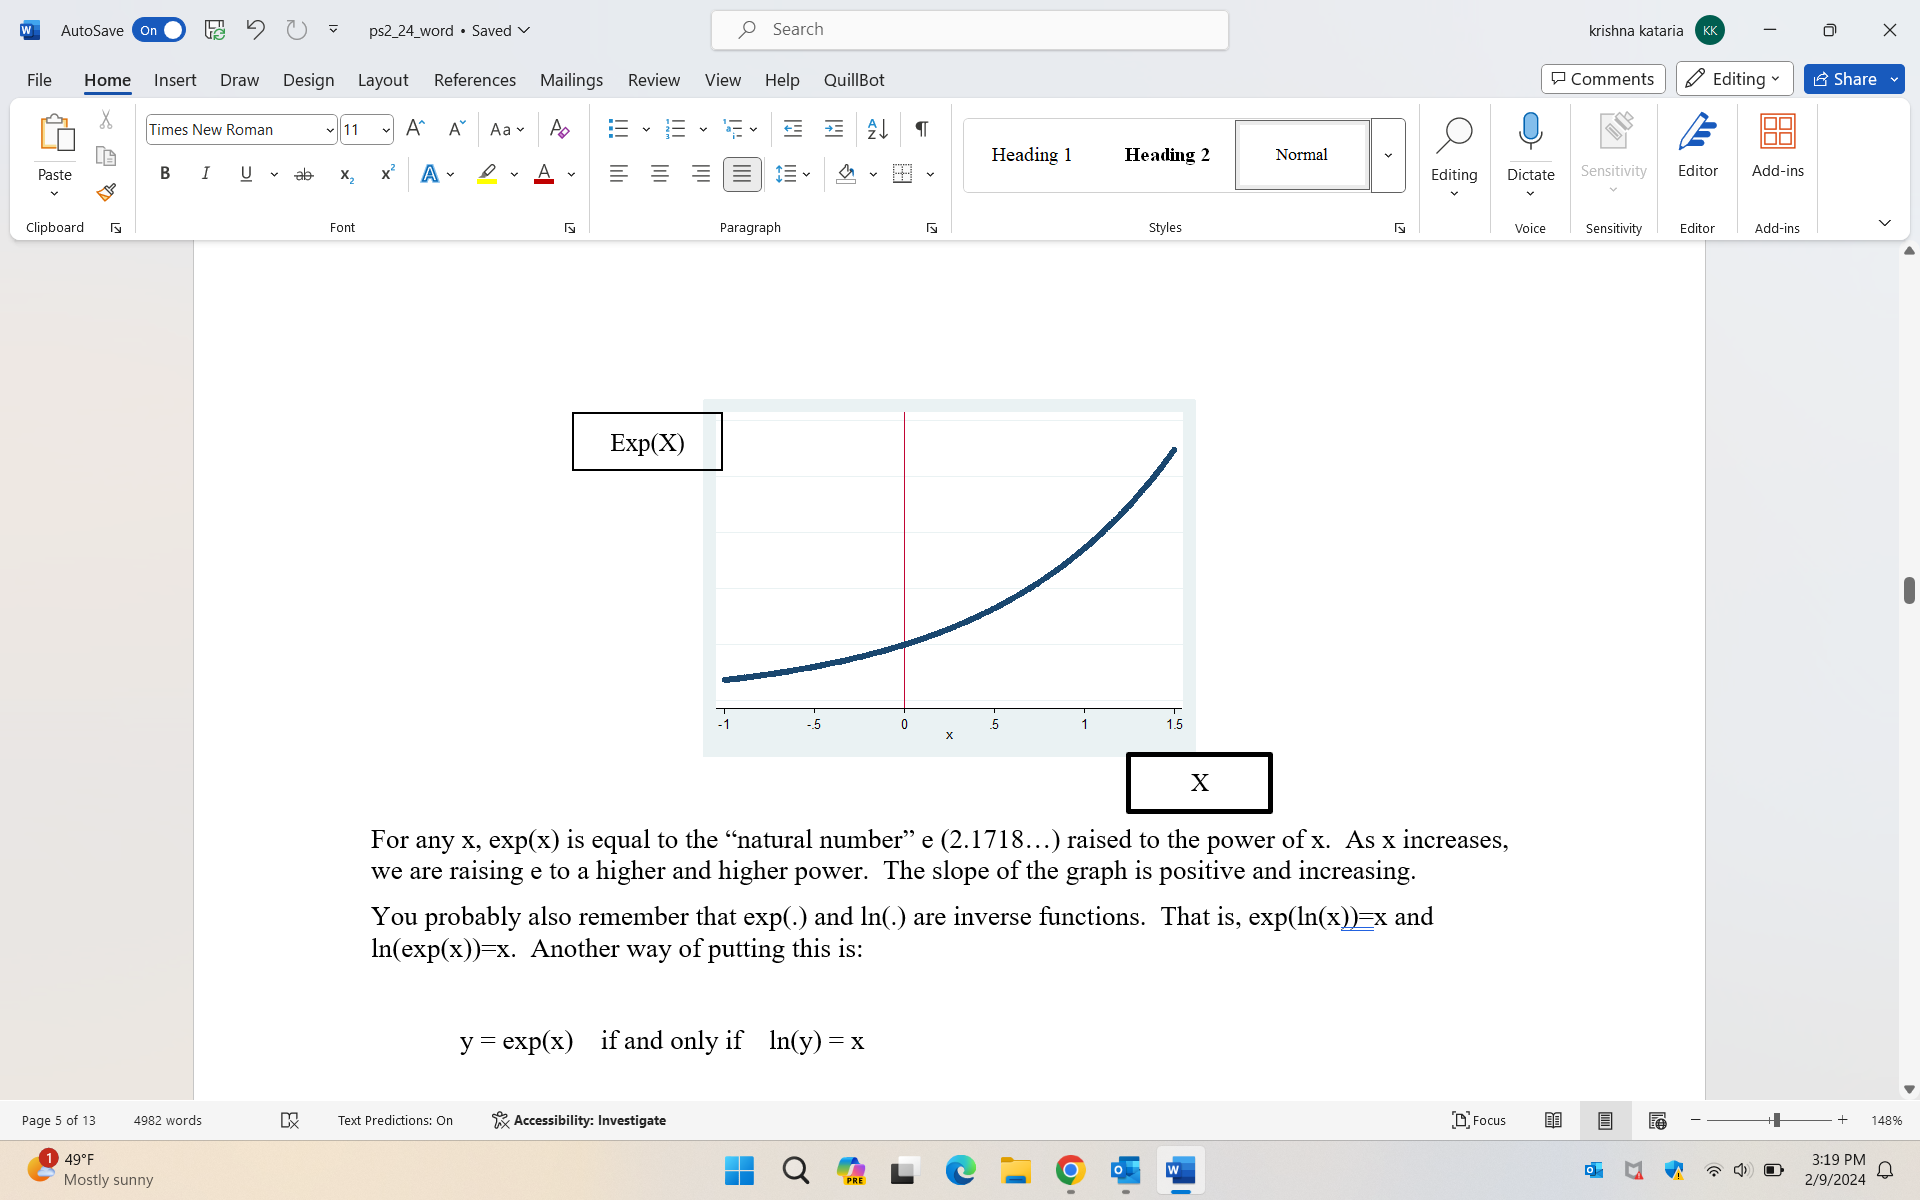
W AutoSave On ps2_24_word Saved Search File Home Insert Draw Design Layout References Mailings Review View Help QuillBot Times New Roman 11 A^ Aa LA Paste BI U ab x A D v A Clipboard Page 5 of 13 149F 4982 words Mostly sunny X Font Paragraph Heading 1 Heading 2 Normal E Styles F krishna kataria KK Comments 0 Editing Share Editing Dictate Sensitivity Editor Add-ins Voice Sensitivity Editor Add-ins You may wish to supplement the exposition that follows by studying the math review materials on the course Canvas site and/or the appendix on math in the Wooldridge textbook. Two functions frequently used in economics and econometrics are the natural logarithm function, ln(.), and the exponential function, exp(.). As you probably recall, the function ln(x) has the shape shown in the graph below (when graphed against x). It is only defined for positive values of x. As x approaches zero, ln(x) approaches negative infinity. As x increases, ln(x) rises at a decreasing rate. That is, the slope is positive but declining as we move to the right in the graph. Y = ln(X) 2.30259 -2.30259- 11 X The function exp(x) has the shape indicated in the graph below (when graphed against x). It is defined for all values of x. As x approaches negative infinity, exp(x) approaches 0. exp(0) is 1, and the exp(x) graph has a y intercept of 1. Text Predictions: On Accessibility: Investigate W DFocus 148% 3:19 PM 2/9/2024
Step by Step Solution
There are 3 Steps involved in it

Get step-by-step solutions from verified subject matter experts