

Question: Required: 1. Complete a schedule that reflects a ratio analysis of each company. (Round your intermediate calculations and final answers to 2 decimal places. Enter
Required:
1. Complete a schedule that reflects a ratio analysis of each company. (Round your intermediate calculations and final answers to 2 decimal places. Enter percentage answers rounded to 2 decimal places (i.e. 0.1234 should be entered as 12.34).)
Quality of Income
Times interest earned ratio
Cash coverage ratio
Debt/equity ratio
Price/earnings ratio
Dividend yield ratio
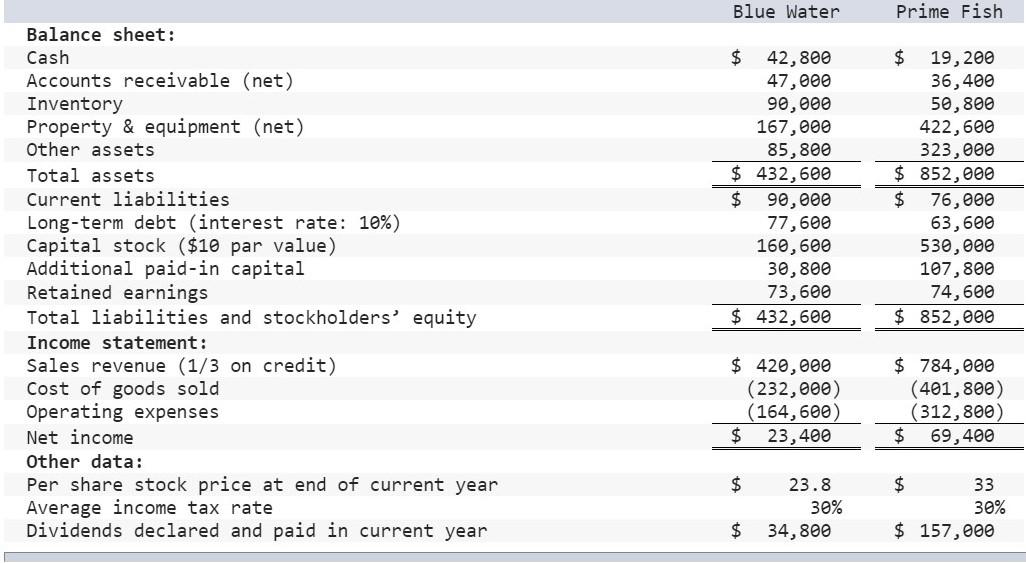
Blue Water Prime Fish Balance sheet: Cash Accounts receivable (net) Inventory Property & equipment (net) Other assets Total assets Current liabilities Long-term debt (interest rate: 10%) Capital stock ($10 par value) Additional paid-in capital Retained earnings Total liabilities and stockholders' equity Income statement: Sales revenue (1/3 on credit) Cost of goods sold Operating expenses Net income Other data: Per share stock price at end of current year Average income tax rate Dividends declared and paid in current year $ 42,800 47,000 90,000 167,000 85,800 $ 432,600 $ 90,000 77,600 160,600 30,800 73,600 $ 432,600 Alta $ 19,200 36,400 50,800 422,600 323,000 $ 852,000 $ 76,000 63,600 530,000 107,800 74,600 $ 852,000 $ 420,000 (232,000) (164,600) $ 23,400 $ 784,000 (401,800) (312,800) $ 69,400 $ 23.8 30% 34,800 $ 33 30% $ 157,000 $
Step by Step Solution
There are 3 Steps involved in it

Get step-by-step solutions from verified subject matter experts