

Question: Required 1. Complete the vertical analysis by computing each missing line item as a percentage of net revenues. TIP: In the prior year (2015), Cost
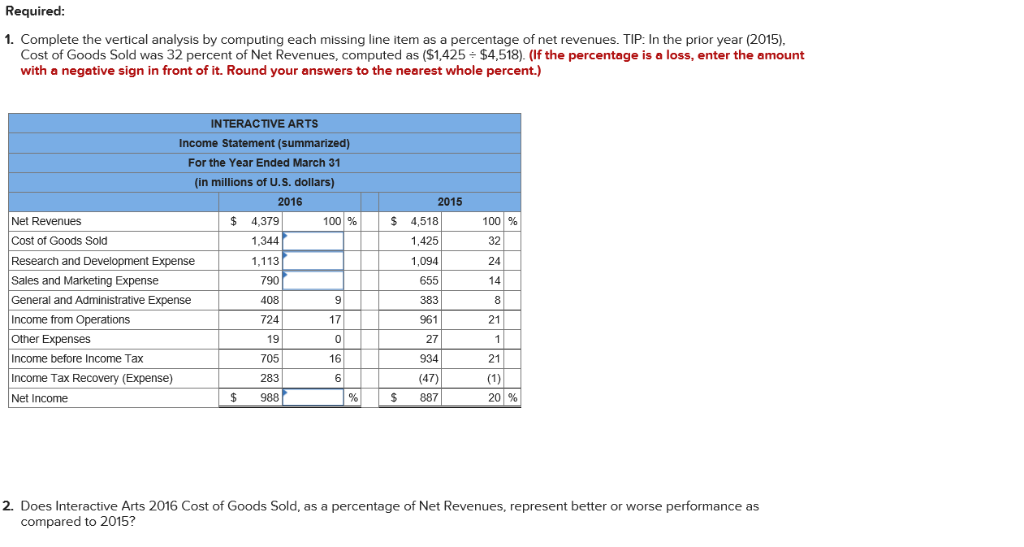
Required 1. Complete the vertical analysis by computing each missing line item as a percentage of net revenues. TIP: In the prior year (2015), Cost of Goods Sold was 32 percent of Net Revenues, computed as ($1,425 $4,518) (If the percentage is a loss, enter the amount with a negative sign in front of it. Round your answers to the nearest whole percent.) INTERACTIVE ARTS Income Statement (summarized) For the Year Ended March 31 in millions of U.S. dollars) 2016 2015 $ 4,379 1.344 1,113 790 Net Rewenues Cost of Goods Sold Research and Development Expense Sales and Marketing Expense General and Administrative Expense Income from Operations Other Expenses Income before Income Tax Income Tax Recovery (Expense) Net Income 100 % $ 4,518 1,425 1,094 655 383 961 27 934 (47) S 887 100 % 32 24 9 17 0 16 8 724 19 705 21 21 20 % $ 988 2. Does Interactive Arts 2016 Cost of Goods Sold, as a percentage of Net Revenues, represent better or worse performance as compared to 20153
Step by Step Solution
There are 3 Steps involved in it

Get step-by-step solutions from verified subject matter experts