

Question: Required: 1. Compute descriptive statistics for the total assets for the retail industry during the past few years. 2. Calculate return on assets and
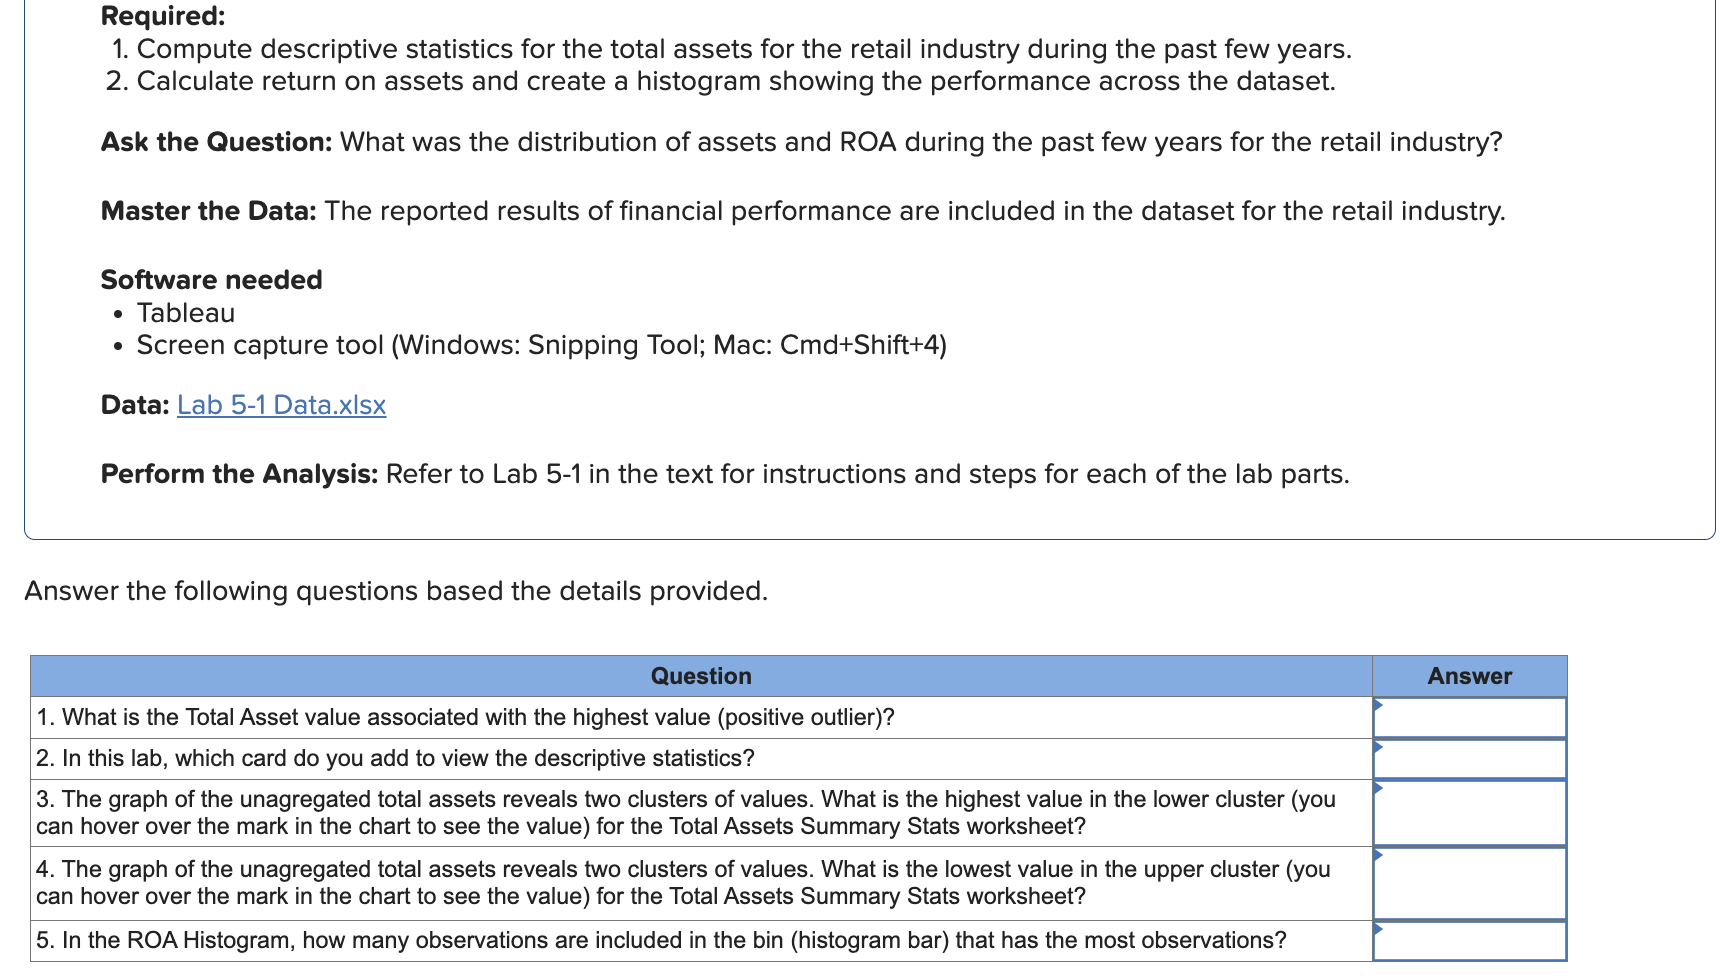

Required: 1. Compute descriptive statistics for the total assets for the retail industry during the past few years. 2. Calculate return on assets and create a histogram showing the performance across the dataset. Ask the Question: What was the distribution of assets and ROA during the past few years for the retail industry? Master the Data: The reported results of financial performance are included in the dataset for the retail industry. Software needed Tableau Screen capture tool (Windows: Snipping Tool; Mac: Cmd+Shift+4) Data: Lab 5-1 Data.xlsx Perform the Analysis: Refer to Lab 5-1 in the text for instructions and steps for each of the lab parts. Answer the following questions based the details provided. Question 1. What is the Total Asset value associated with the highest value (positive outlier)? 2. In this lab, which card do you add to view the descriptive statistics? 3. The graph of the unagregated total assets reveals two clusters of values. What is the highest value in the lower cluster (you can hover over the mark in the chart to see the value) for the Total Assets Summary Stats worksheet? 4. The graph of the unagregated total assets reveals two clusters of values. What is the lowest value in the upper cluster (you can hover over the mark in the chart to see the value) for the Total Assets Summary Stats worksheet? 5. In the ROA Histogram, how many observations are included in the bin (histogram bar) that has the most observations? Answer 1. Take a screenshot of your summary statistics of total assets, paste it into a Word document named "Lab 5-1 Tableau SS.doc", and label the screenshot Submission 1. 2. Take a screenshot of your ROA histogram, paste it into your Word document named "Lab 5-1 Tableau SS.doc", and label the screenshot Submission 2.
Step by Step Solution
There are 3 Steps involved in it

Get step-by-step solutions from verified subject matter experts