

Question: Required: 1. Conduct a horizontal analysis by calculating the year-over-year changes in each line item, expressed in dollars and in percentages for the income statement
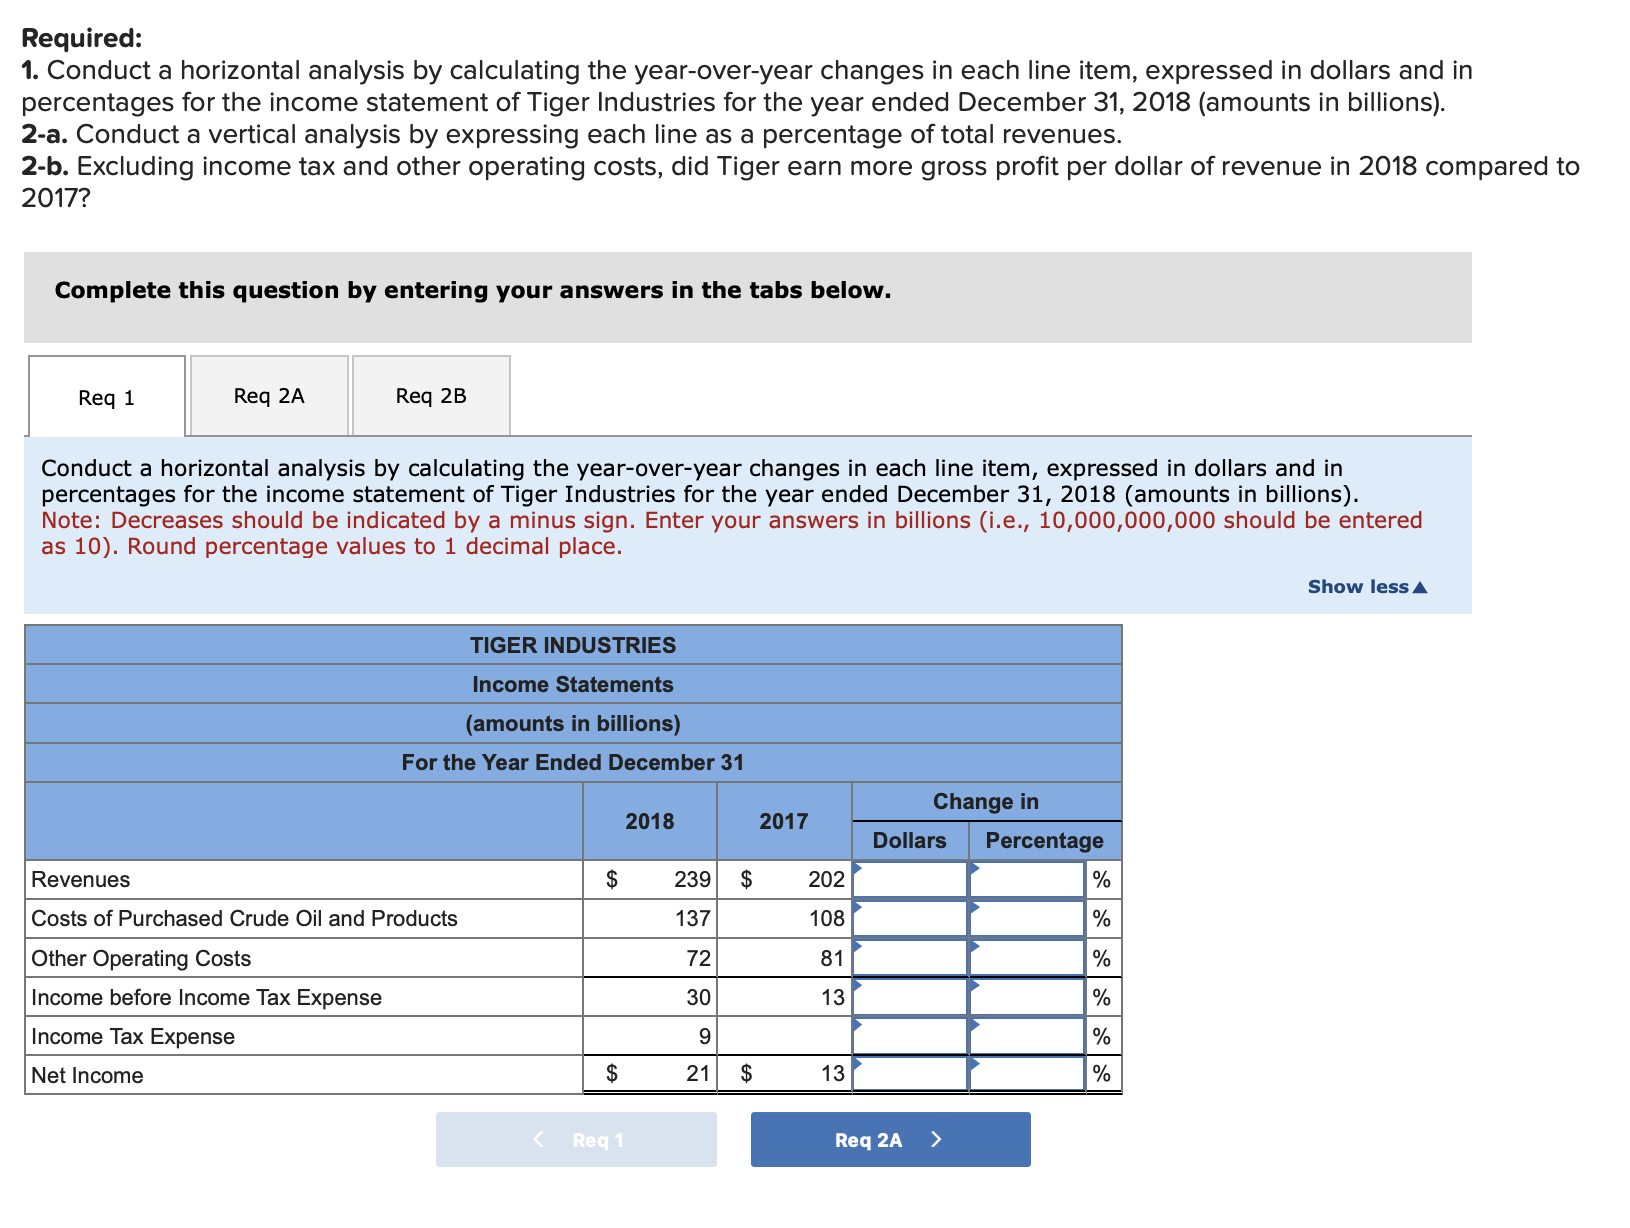
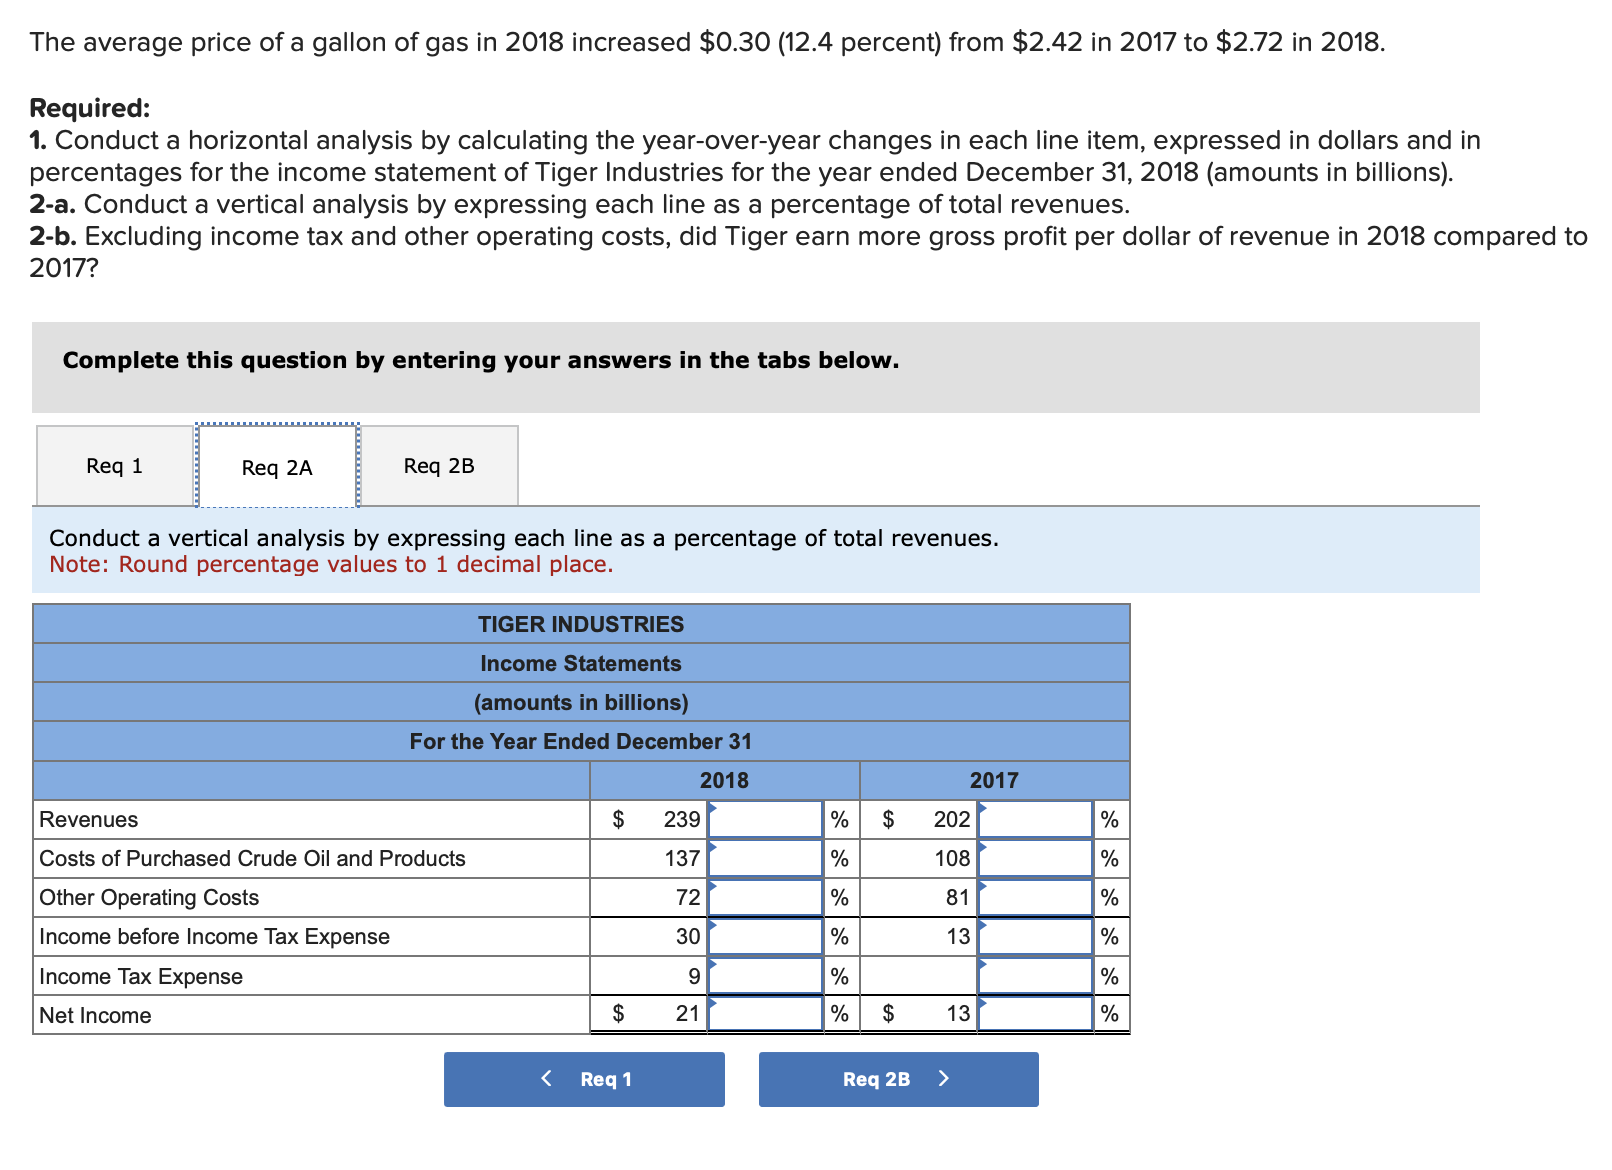
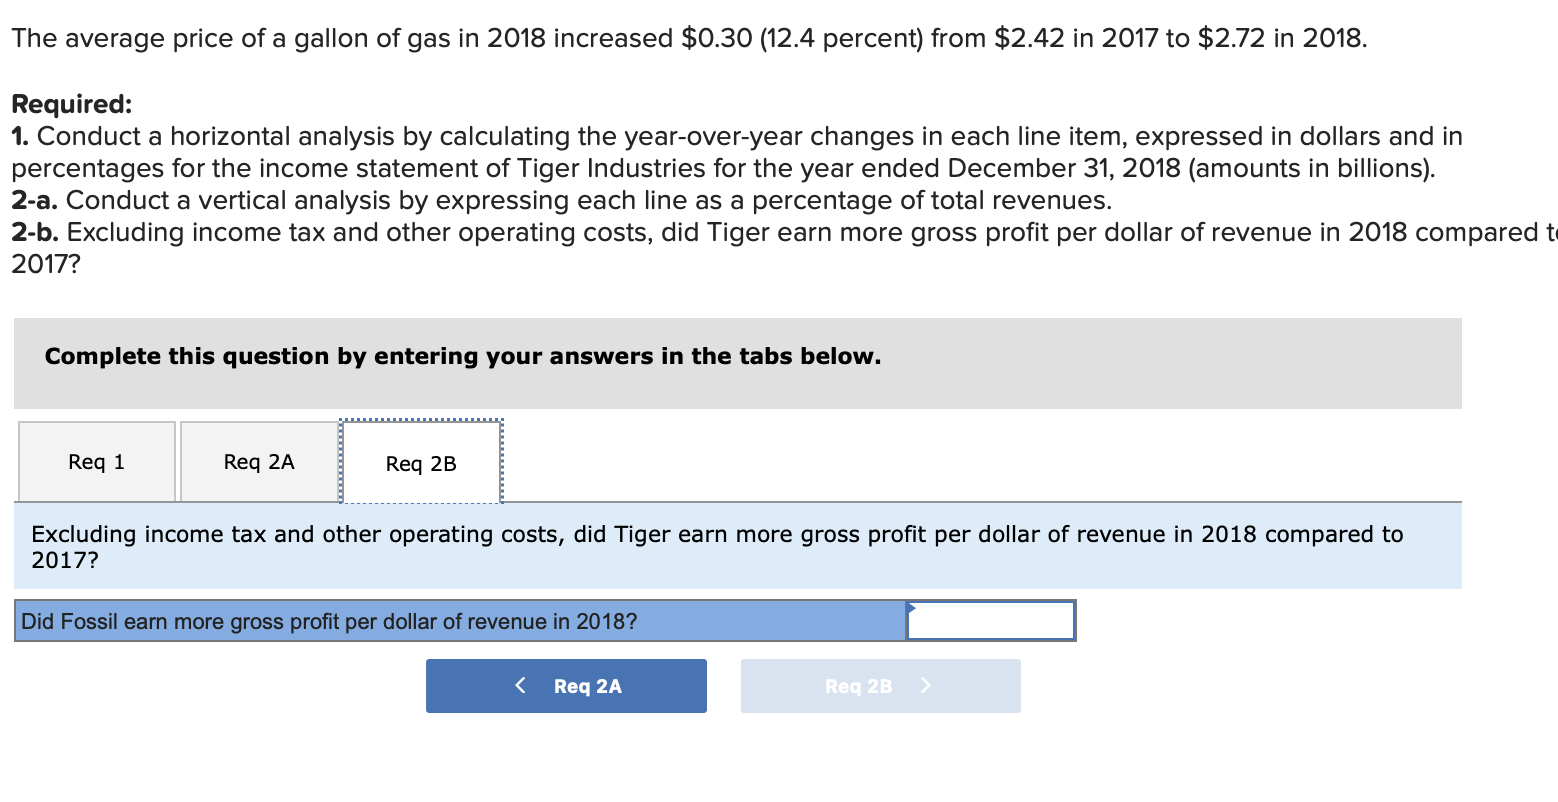
Required: 1. Conduct a horizontal analysis by calculating the year-over-year changes in each line item, expressed in dollars and in percentages for the income statement of Tiger Industries for the year ended December 31, 2018 (amounts in billions). 2-a. Conduct a vertical analysis by expressing each line as a percentage of total revenues. 2-b. Excluding income tax and other operating costs, did Tiger earn more gross profit per dollar of revenue in 2018 compare 2017? Complete this question by entering your answers in the tabs below. Conduct a horizontal analysis by calculating the year-over-year changes in each line item, expressed in dollars and in percentages for the income statement of Tiger Industries for the year ended December 31, 2018 (amounts in billions). Note: Decreases should be indicated by a minus sign. Enter your answers in billions (i.e., 10,000,000,000 should be entered as 10 ). Round percentage values to 1 decimal place. The average price of a gallon of gas in 2018 increased $0.30 (12.4 percent) from \$2.42 in 2017 to $2.72 in 2018 . Required: 1. Conduct a horizontal analysis by calculating the year-over-year changes in each line item, expressed in dollars and in percentages for the income statement of Tiger Industries for the year ended December 31, 2018 (amounts in billions). 2-a. Conduct a vertical analysis by expressing each line as a percentage of total revenues. 2-b. Excluding income tax and other operating costs, did Tiger earn more gross profit per dollar of revenue in 2018 compar 2017? Complete this question by entering your answers in the tabs below. Conduct a vertical analysis by expressing each line as a percentage of total revenues. Note: Round percentage values to 1 decimal place. The average price of a gallon of gas in 2018 increased $0.30 (12.4 percent) from \$2.42 in 2017 to \$2.72 in 2018 . Required: 1. Conduct a horizontal analysis by calculating the year-over-year changes in each line item, expressed in dollars and in percentages for the income statement of Tiger Industries for the year ended December 31, 2018 (amounts in billions). 2-a. Conduct a vertical analysis by expressing each line as a percentage of total revenues. 2-b. Excluding income tax and other operating costs, did Tiger earn more gross profit per dollar of revenue in 2018 compare 2017? Complete this question by entering your answers in the tabs below. Excluding income tax and other operating costs, did Tiger earn more gross profit per dollar of revenue in 2018 compared to 2017? Did Fossil earn more gross profit per dollar of revenue in 2018
Step by Step Solution
There are 3 Steps involved in it

Get step-by-step solutions from verified subject matter experts