

Question: Required: 1- Enter the first table (with same format) into new worksheet named Data 2- Enter the second table (with same format) into new worksheet
Required:
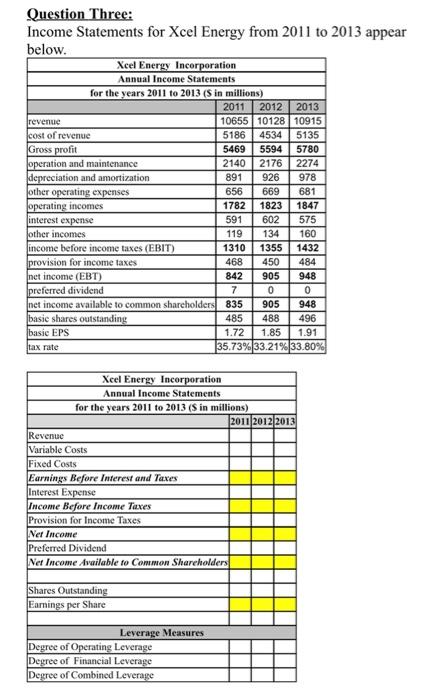
Assume that Cost of Revenue and Operation and Maintenance costs are variable. Depreciation and Other operating expenses are fixed costs. Ignore Other income when calculating EBT for the questions below.
Income Statements for Xcel Energy from 2011 to 2013 appear below.
Xcel Energy Incorporation | |||
Annual Income Statements | |||
for the years 2011 to 2013 ($ in millions) | |||
| 2011 | 2012 | 2013 |
revenue | 10655 | 10128 | 10915 |
cost of revenue | 5186 | 4534 | 5135 |
Gross profit | 5469 | 5594 | 5780 |
operation and maintenance | 2140 | 2176 | 2274 |
depreciation and amortization | 891 | 926 | 978 |
other operating expenses | 656 | 669 | 681 |
operating incomes | 1782 | 1823 | 1847 |
interest expense | 591 | 602 | 575 |
other incomes | 119 | 134 | 160 |
income before income taxes (EBIT) | 1310 | 1355 | 1432 |
provision for income taxes | 468 | 450 | 484 |
net income (EBT) | 842 | 905 | 948 |
preferred dividend | 7 | 0 | 0 |
net income available to common shareholders | 835 | 905 | 948 |
basic shares outstanding | 485 | 488 | 496 |
basic EPS | 1.72 | 1.85 | 1.91 |
tax rate | 35.73% | 33.21% | 33.80% |
Xcel Energy Incorporation | |||
Annual Income Statements | |||
for the years 2011 to 2013 ($ in millions) | |||
| 2011 | 2012 | 2013 |
Revenue |
|
|
|
Variable Costs |
|
|
|
Fixed Costs |
|
|
|
Earnings Before Interest and Taxes |
|
|
|
Interest Expense |
|
|
|
Income Before Income Taxes |
|
|
|
Provision for Income Taxes |
|
|
|
Net Income |
|
|
|
Preferred Dividend |
|
|
|
Net Income Available to Common Shareholders |
|
|
|
|
|
|
|
Shares Outstanding |
|
|
|
Earnings per Share |
|
|
|
|
|
|
|
Leverage Measures | |||
Degree of Operating Leverage |
|
|
|
Degree of Financial Leverage |
|
|
|
Degree of Combined Leverage |
|
|
|
Required:
Assume that Cost of Revenue and Operation and Maintenance costs are variable. Depreciation and Other operating expenses are fixed costs. Ignore Other income when calculating EBT for the questions below.
Question Three: Income Statements for Xcel Energy from 2011 to 2013 appear helow
Step by Step Solution
There are 3 Steps involved in it

Get step-by-step solutions from verified subject matter experts