

Question: Required: 1. Prepare a detailed income statement variance analysis using the contribution approach income statement for the year (i.e., compare the actual income statement with
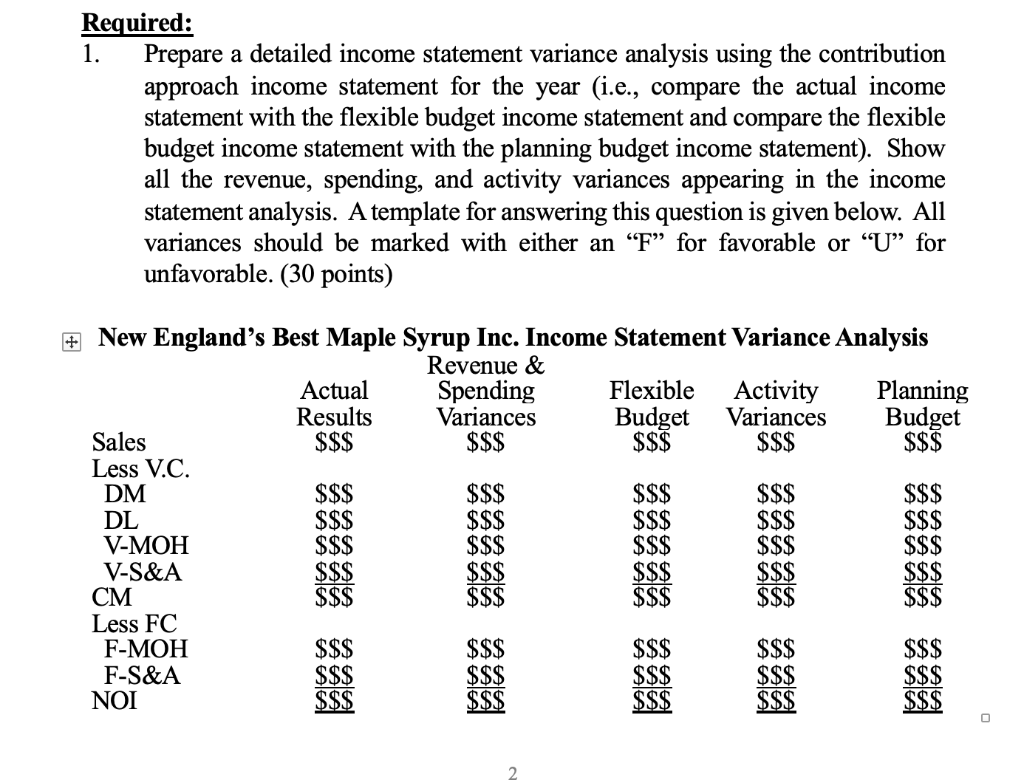
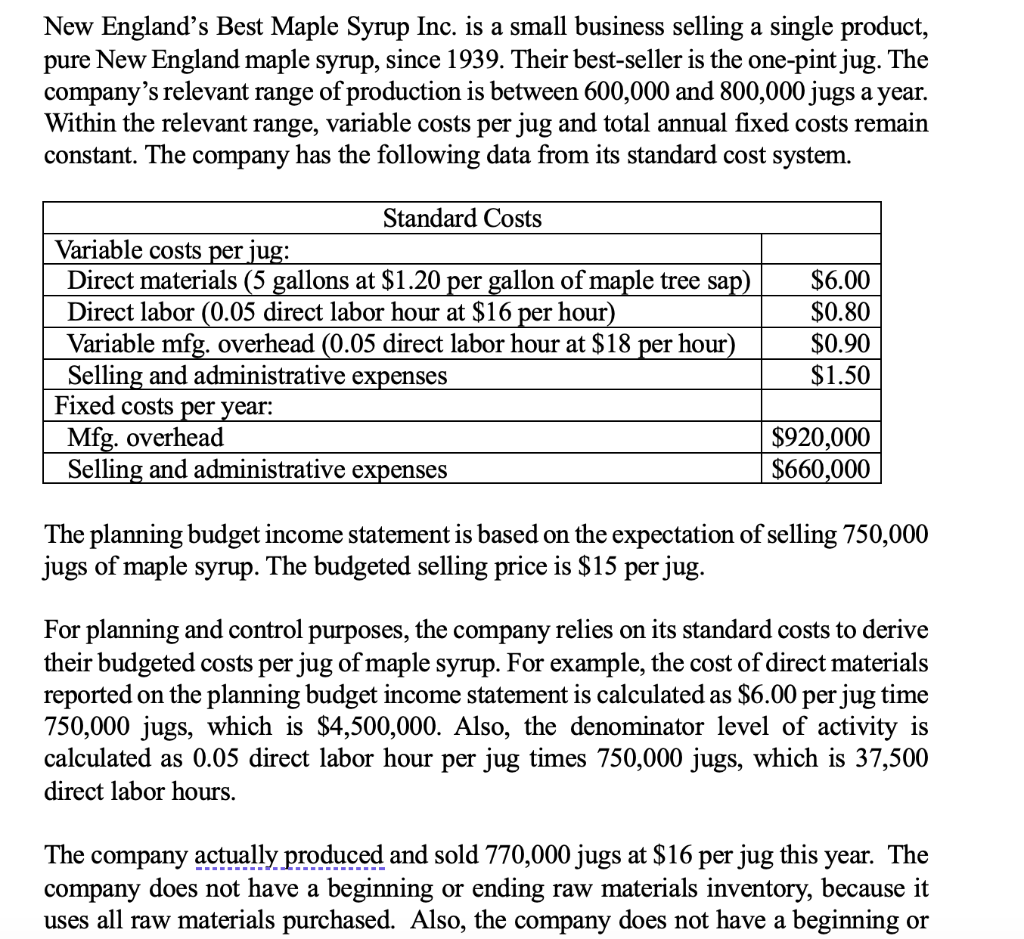
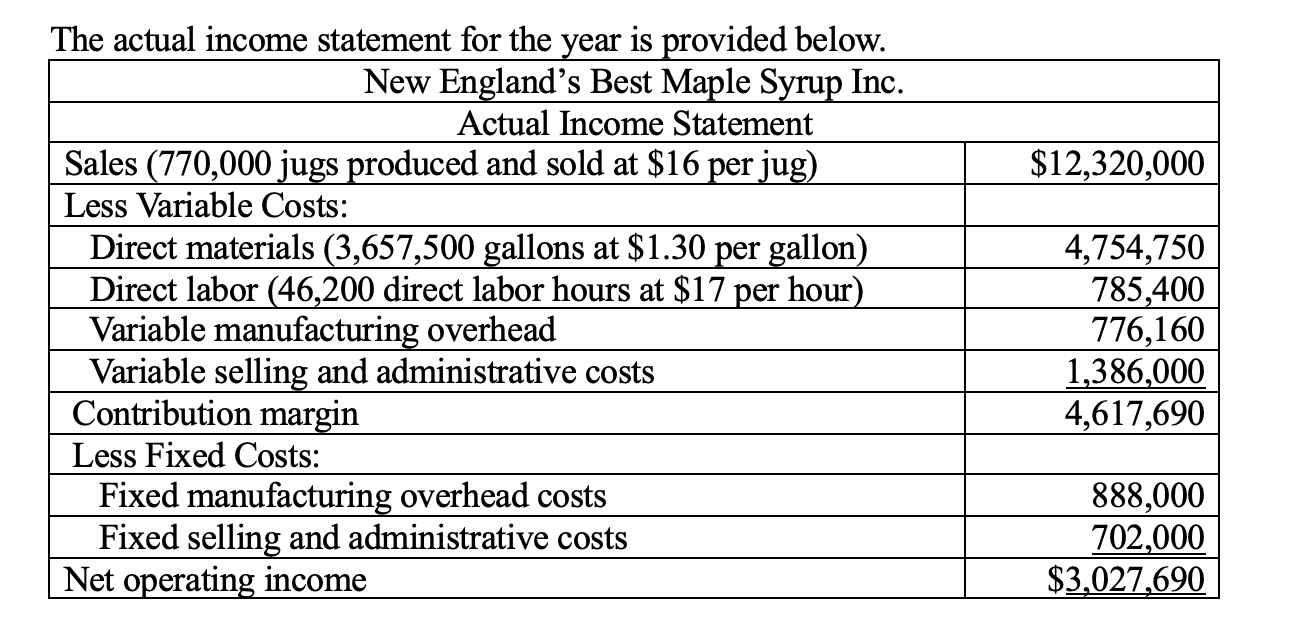
Required: 1. Prepare a detailed income statement variance analysis using the contribution approach income statement for the year (i.e., compare the actual income statement with the flexible budget income statement and compare the flexible budget income statement with the planning budget income statement). Show all the revenue, spending, and activity variances appearing in the income statement analysis. A template for answering this question is given below. All variances should be marked with either an "F" for favorable or "U" for unfavorable. (30 points) New England's Best Maple Syrup Inc. Income Statement Variance Analysis New England's Best Maple Syrup Inc. is a small business selling a single product, pure New England maple syrup, since 1939. Their best-seller is the one-pint jug. The company's relevant range of production is between 600,000 and 800,000 jugs a year. Within the relevant range, variable costs per jug and total annual fixed costs remain constant. The company has the following data from its standard cost system. The planning budget income statement is based on the expectation of selling 750,000 jugs of maple syrup. The budgeted selling price is $15 per jug. For planning and control purposes, the company relies on its standard costs to derive their budgeted costs per jug of maple syrup. For example, the cost of direct materials reported on the planning budget income statement is calculated as $6.00 per jug time 750,000 jugs, which is $4,500,000. Also, the denominator level of activity is calculated as 0.05 direct labor hour per jug times 750,000 jugs, which is 37,500 direct labor hours. The company actually produced and sold 770,000 jugs at $16 per jug this year. The company does not have a beginning or ending raw materials inventory, because it uses all raw materials purchased. Also, the company does not have a beginning or The actual income statement for the year is provided below. \begin{tabular}{|l|r|} \hline \multicolumn{2}{|c|}{ New England's Best Maple Syrup Inc. } \\ \hline \multicolumn{2}{|c|}{ Actual Income Statement } \\ \hline Sales (770,000 jugs produced and sold at $16 per jug) & $12,320,000 \\ \hline Less Variable Costs: & 4,754,750 \\ \hline Direct materials (3,657,500 gallons at $1.30 per gallon) & 785,400 \\ \hline Direct labor (46,200 direct labor hours at $17 per hour) & 776,160 \\ \hline Variable manufacturing overhead & 1,386,000 \\ \hline Variable selling and administrative costs & 4,617,690 \\ \hline Contribution margin & 888,000 \\ \hline Less Fixed Costs: & 702,000 \\ \hline Fixed manufacturing overhead costs & $3,027,690 \\ \hline Fixed selling and administrative costs & 3 \\ \hline Net operating income & 1600 \\ \hline \end{tabular}
Step by Step Solution
There are 3 Steps involved in it

Get step-by-step solutions from verified subject matter experts