

Question: Consider a mechanical mass-spring-damper system that is critically damped. For this system with a damping factor of (= 1 the governing equation has a
![displacement x(t/m] -0.1 -02 -0.3 -0.4 -0.5 -0.6 CH -0.7 -0.8 velocity v(1)[m.s 0.2 0.8 0.6 04 0.2 0 -0,2](https://dsd5zvtm8ll6.cloudfront.net/si.experts.images/questions/2023/07/64c0abdaec88d_1690348500570.jpg)
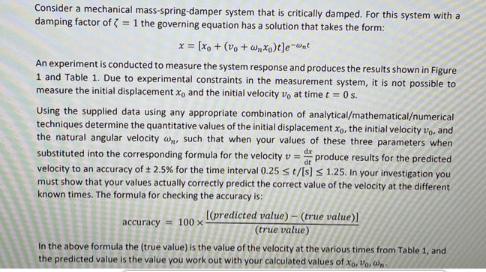
Consider a mechanical mass-spring-damper system that is critically damped. For this system with a damping factor of (= 1 the governing equation has a solution that takes the form: x= [Xo+ (vo+wnxo)tlet An experiment is conducted to measure the system response and produces the results shown in Figure 1 and Table 1. Due to experimental constraints in the measurement system, it is not possible to measure the initial displacement x, and the initial velocity 16 at time t = 0 s. Using the supplied data using any appropriate combination of analytical/mathematical/numerical techniques determine the quantitative values of the initial displacement xo, the initial velocity and the natural angular velocity a such that when your values of these three parameters when substituted into the corresponding formula for the velocity v=produce results for the predicted velocity to an accuracy of 2.5% for the time interval 0.25 st/[s] 1.25. In your investigation you must show that your values actually correctly predict the correct value of the velocity at the different. known times. The formula for checking the accuracy is: accuracy 100 x- In the above formula the (true value) is the value of the velocity at the various times from Table 1, and the predicted value is the value you work out with your calculated values of Xoro [(predicted value)-(true value)] (true value) displacement x(t/m] -0.1 -02 -0.3 -0.4 -0.5 -0.6 CH -0.7 -0.8 velocity v(1)[m.s 0.2 0.8 0.6 04 0.2 0 -0,2 -0.4 -0.6 -0.8 0.2 16 Time t/[s] 0,2500 0.36111 0.47222 0.58333 0.69444 0.80556 0.91667 1.02778 1.13889 1.25000 04 0.4 Graphs of System Response 9 0.6 0.6 0.8 time [s] 0.8 time [s] Figure 1 Graph of system response displacement and velocity 12 12 Table 1 Tabular data of system response displacement and velocity Displacement x/[m] -0.62196 -0.62892 -0.58133 -0.50974 -0.43171 -0.35673 -0.28941 -0.23147 -0.18304 -0.14341 14 0.69242 0.69838 0.64464 0.56475 0.47801 0.39481 0.32019 14 Velocity v/m.s -0.44145 0.24131 0.57057
Step by Step Solution
3.38 Rating (164 Votes )
There are 3 Steps involved in it
AnalyticalMathematicalNumerical Techniques To determine the quantitative values of the initial displacement xothe initial velocity v1and the natural a... View full answer

Get step-by-step solutions from verified subject matter experts