

Question: Required: 2. Using the Data Table What-lf Analysis tool in Excel, determine the Units and Operating Income (Loss) for each product based on the following
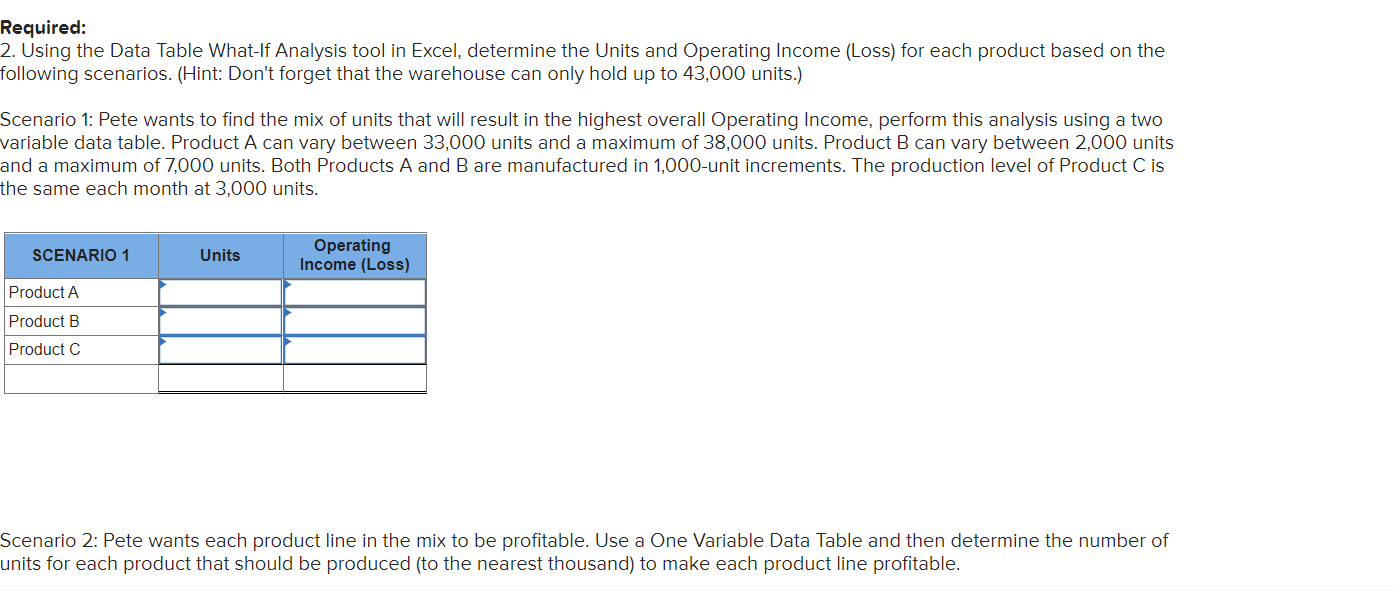
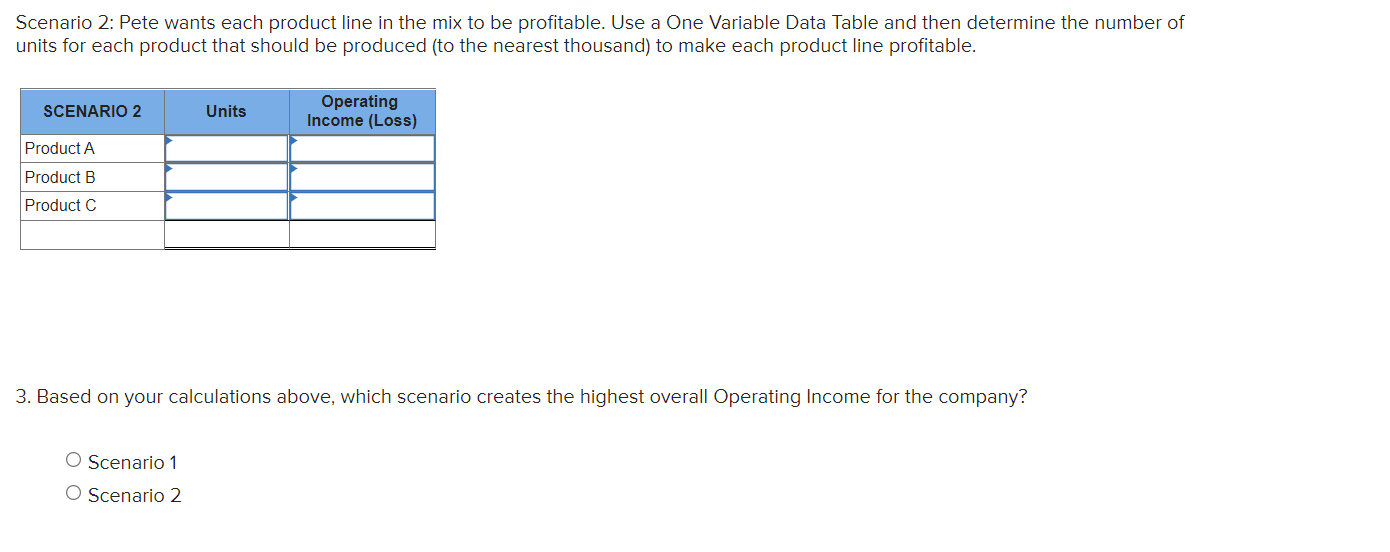
Required: 2. Using the Data Table What-lf Analysis tool in Excel, determine the Units and Operating Income (Loss) for each product based on the following scenarios. (Hint: Don't forget that the warehouse can only hold up to 43,000 units.) Scenario 1: Pete wants to find the mix of units that will result in the highest overall Operating Income, perform this analysis using a two variable data table. Product A can vary between 33,000 units and a maximum of 38,000 units. Product B can vary between 2,000 units and a maximum of 7,000 units. Both Products A and are manufactured in 1,000-unit increments. The production level of Product C is the same each month at 3,000 units. SCENARIO 1 Units Operating Income (Loss) Product A Product B Product C Scenario 2: Pete wants each product line in the mix to be profitable. Use a One Variable Data Table and then determine the number of units for each product that should be produced (to the nearest thousand) to make each product line profitable. Scenario 2: Pete wants each product line in the mix to be profitable. Use a One Variable Data Table and then determine the number of units for each product that should be produced (to the nearest thousand) to make each product line profitable. SCENARIO 2 Units Operating Income (Loss) Product A Product B Product C 3. Based on your calculations above, which scenario creates the highest overall Operating Income for the company? O Scenario 1 O Scenario 2 Required: 2. Using the Data Table What-lf Analysis tool in Excel, determine the Units and Operating Income (Loss) for each product based on the following scenarios. (Hint: Don't forget that the warehouse can only hold up to 43,000 units.) Scenario 1: Pete wants to find the mix of units that will result in the highest overall Operating Income, perform this analysis using a two variable data table. Product A can vary between 33,000 units and a maximum of 38,000 units. Product B can vary between 2,000 units and a maximum of 7,000 units. Both Products A and are manufactured in 1,000-unit increments. The production level of Product C is the same each month at 3,000 units. SCENARIO 1 Units Operating Income (Loss) Product A Product B Product C Scenario 2: Pete wants each product line in the mix to be profitable. Use a One Variable Data Table and then determine the number of units for each product that should be produced (to the nearest thousand) to make each product line profitable. Scenario 2: Pete wants each product line in the mix to be profitable. Use a One Variable Data Table and then determine the number of units for each product that should be produced (to the nearest thousand) to make each product line profitable. SCENARIO 2 Units Operating Income (Loss) Product A Product B Product C 3. Based on your calculations above, which scenario creates the highest overall Operating Income for the company? O Scenario 1 O Scenario 2
Step by Step Solution
There are 3 Steps involved in it

Get step-by-step solutions from verified subject matter experts