

Question: Required Calculate each year's current ratio. Calculate income statement data in common-size percent. Calculate the balance sheet data in trend percent with 2019 as base
Required
Calculate each year's current ratio.
Calculate income statement data in common-size percent.
Calculate the balance sheet data in trend percent with 2019 as base year.
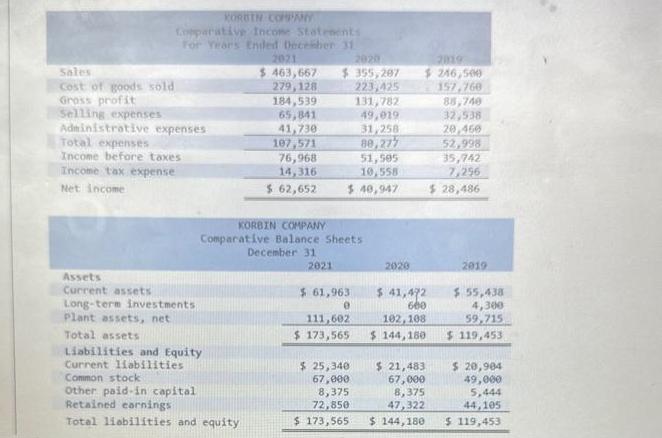
Sales Cost of goods sold Gross profit Selling expenses KORDIN COMPANY Comparative Income Statements or Years Ended December 31 Administrative expenses Total expenses Income before taxes Income tax expense Net income Assets Current assets Long-term investments Plant assets, net Total assets 2021 $.463,667 279,128 184,539 65,841 41,730 Liabilities and Equity Current liabilities Common stock Other paid-in capital Retained earnings Total liabilities and equity 107,571 76,968 14,316 $ 62,652 2020 $355,207 223,425 2021 KORBIN COMPANY Comparative Balance Sheets December 31 51,505 10,558 $ 40,947 $ 61,963 0 131,782 49,019 31,258 80,277 111,602 $ 173,565 $ 25,340 67,000 8,375 72,850 $ 173,565 2020 2019 $246,500 157,760 85,740 $ 41,42 600 102,108 $ 144,180 32,538 20.460 52,998 35,742 7,256 $28,486 2019 $ 55,438 4,300 59,715 $ 119,453 $ 20,904 $ 21,483 67,000 49,000 8,375 5,444 47,322 44,105 $ 144,180 $ 119,453
Step by Step Solution
3.53 Rating (153 Votes )
There are 3 Steps involved in it
Current Ratio 2021 Current Assets Current Liabilities 61963 41472 149 2020 Current Assets Current Li... View full answer

Get step-by-step solutions from verified subject matter experts