

Question: ********* required: Industry average Financial Ratio Analysis Profitability Ratios 15% *Total revenue = operating revenue + nonoperating revenue Net income Total margin = = ..
*********
required:
| Industry average | Financial Ratio Analysis
| |
| Profitability Ratios | ||
|
15% | *Total revenue = operating revenue + nonoperating revenue | Net income Total margin = = .. % Total revenue
|
|
20% | Operating income Operating margin = = .. % Operating revenue
| |
|
6% | * return on assets (ROA( | Net income ROA = = % Total assets |
|
12% | * return on equity (ROE( | Net income ROE = = . % Total equity |
| Industry average | Financial Ratio Analysis
| |
| Liquidity Ratios | ||
|
1.5 Times | * current ratio (CR) = liquidity ratio * current assets (CA) * current liabilities (CL) | CA CR = = .. Times CL |
|
20 days
| * Days cash on hand (DCOH * Marketable securities= Short-term investments * Cash expenses = Total expenses (Depreciation + Provision for uncollectibles) |
Cash + Marketable securities DCOH = = . days Cash expenses / 365 |
| Industry average | Financial Ratio Analysis
| |
| Debt Management Ratios | ||
|
14%
|
Total debt = Total liabilities |
Total debt Debt ratio = = . % Total assets
|
| 2 Times | * Times interest earned (TIE) * earnings before interest and taxes (EBIT) = Net income + Interest Expense + Taxes | EBIT TIE ratio = = . Times Interest expense
|
| Industry average | Financial Ratio Analysis
| |
| Asset Management Ratios | ||
|
1.4 Times | * fixed- asset turnover ratio * Total revenue = operating revenue + nonoperating revenue
* Net fixed assets = Net plant and equipment |
Total revenue FA turnover = = .. Times Net fixed assets |
|
1.2 Times | * Total - asset turnover Ratio
|
Total revenue TA turnover = = Times Total assets
|
|
25 Days | * average collection Period (ACP) * Net patient accounts rec. = Accounts receivable |
Net patient accounts rec. ACP = = days Net patient service rev. / 365
|
| Return on equity | ||
| ROE = return on equity | ROE = Total Margin x TA turnover x Equity multiplier
NI Rev TA = X X Rev TA TE
|
| Industry average | Financial Ratio Analysis
| |
| Operating Indicator Analysis | ||
| Net Price Per Discharge | ||
|
800 SR | * Net Price Per Discharge (NPPO) |
Net inpatient revenue NPPD = = .. SR. Total discharges
|
| Occupancy Percentage (Rate) | ||
| Inpatient days OR = = patients Number of staffed beds x 365
| ||
| Economic Value Added (EVA) | ||
| * Economic Value Added (EVA)
*NOPAT = net operating profit after taxe
*CCC = corporate cost of capital
* earnings before interest and taxes (EBIT)
|
EVA = Dollar earnings Dollar cost to investors of capital employed
= NOPAT Dollar capital costs
= (EBIT x [1 - T] (Total assets x CCC)
|
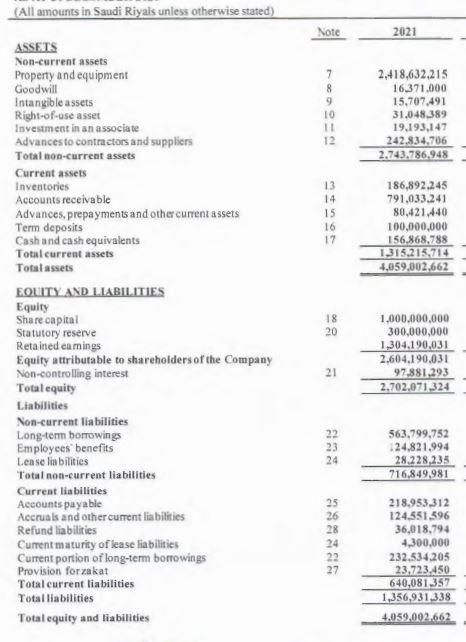
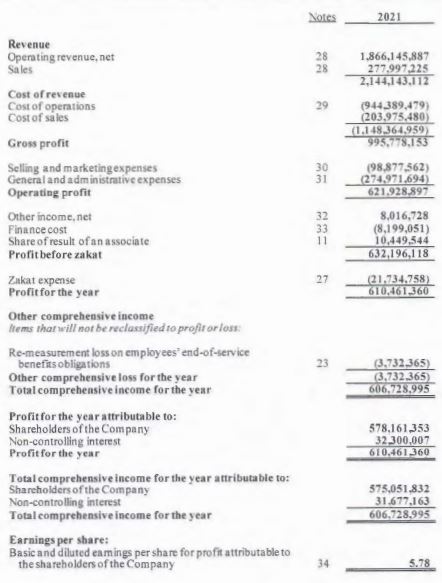
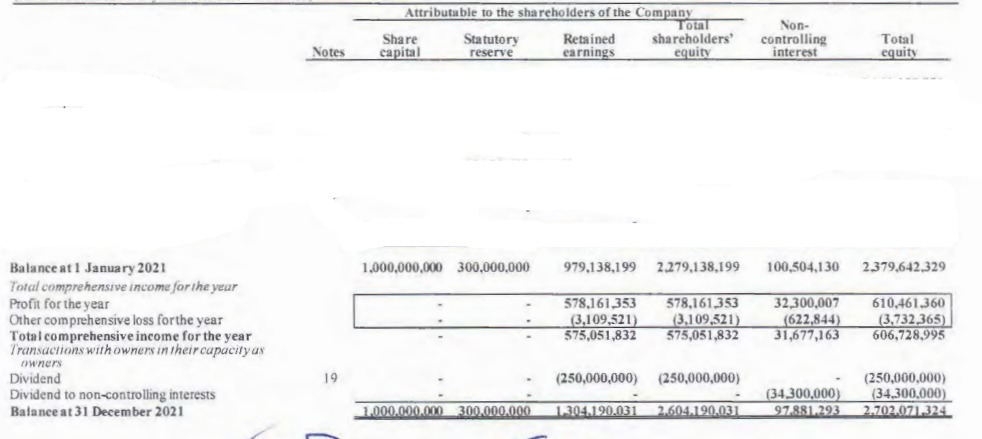
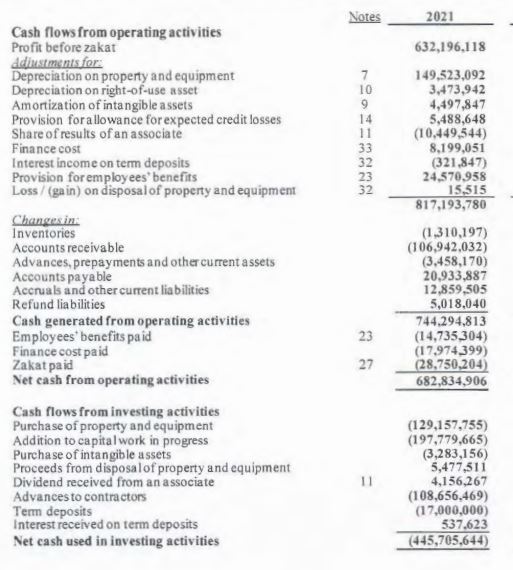
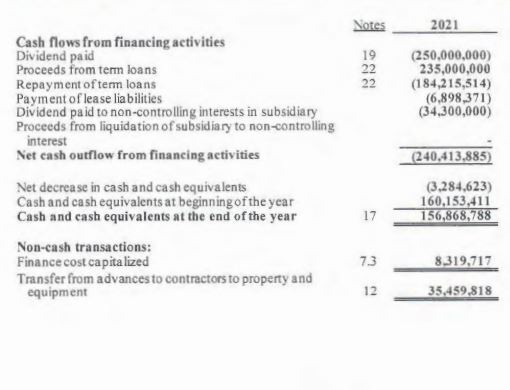
(All amounts in Saudi Riyals unless otherwise stated) \begin{tabular}{|c|c|c|} \hline & Note. & 2021 \\ \hline \multicolumn{3}{|l|}{ ASSEIS } \\ \hline \multicolumn{3}{|l|}{ Non-current assets } \\ \hline Property and equipment & 7 & 2,418,632,215 \\ \hline Goodwill & 8 & 16.371 .000 \\ \hline Intangible assets & 9 & 15,707,491 \\ \hline Right-of-use asset & 10 & 31,048,389 \\ \hline Investment in an associate & it & 19,193,147 \\ \hline Advances to contractors and suppliers & 12 & 242,834,706 \\ \hline Total non-current assets & & 2,743,786,948 \\ \hline \multicolumn{3}{|l|}{ Current assets } \\ \hline Inveatories & 13 & 186,892,245 \\ \hline Accounts receivable & 14 & 791,033.241 \\ \hline Advances, prepayments and other current assets & 15 & 80,421,440 \\ \hline Tern deposits & 16 & 100,000,000 \\ \hline Cash and cash equivalents & 17 & 156,868,788 \\ \hline Total current assets & & 1,315,215,714 \\ \hline Total assets & & 4,059,002,662 \\ \hline \multicolumn{3}{|l|}{ EOUITY AND LIABILITIES } \\ \hline \multicolumn{3}{|l|}{ Equity } \\ \hline Share capital & 18 & 1,000,000,000 \\ \hline Statutory reserve & 20 & 300,000,000 \\ \hline Reta ined eamings & & 1,304,190,031 \\ \hline Equity attributable to shareholders of the Company & & 2,604,190,031 \\ \hline Non-controlling interest & 21 & 97,881,293 \\ \hline Total equity & & 2,702,071,324 \\ \hline \multicolumn{3}{|l|}{ Liabilities } \\ \hline \multicolumn{3}{|l|}{ Non-current liabilities } \\ \hline Long-term borrowing & 22 & 563,799,752 \\ \hline Employees' benefits & 23 & 124,821,994 \\ \hline Lease liabilities & 24 & 28.228,235 \\ \hline Total non-current liabilities & & 716.849,981 \\ \hline \multicolumn{3}{|l|}{ Current liabilities } \\ \hline Accounts payable & 25 & 218,953,312 \\ \hline Aceruals and other current liabilities & 26 & 124,551,596 \\ \hline Refund liabilities & 28 & 36,018,794 \\ \hline Cument maturity of lease liabilities & 24 & 4,300,000 \\ \hline Current portion of long-term borrowings & 22 & 232,534,205 \\ \hline Provision forzakat & 27 & 23,723,450 \\ \hline Total current liabilities & & 640,081,357 \\ \hline Totalliabilities & & 1,356,931,338 \\ \hline Total equity and liabilities & & 4,059,002,662 \\ \hline \end{tabular} \begin{tabular}{|c|c|c|} \hline & Dotes & 2021 \\ \hline \multicolumn{3}{|l|}{ Revenue } \\ \hline Operating revenue, net & 28 & 1,866,145,887 \\ \hline \multirow{2}{*}{ Sales } & 28 & \begin{tabular}{r} 277,997,225 \\ 214+13,112 \end{tabular} \\ \hline & Cost of revenue & 2,144,143,112 \\ \hline Cost of operations & 29 & (944,389,479) \\ \hline \multirow[t]{2}{*}{ Cost of sales } & & (203,975,480) \\ \hline & & (1.148.364.959) \\ \hline \multicolumn{2}{|l|}{ Gross profit } & 995,778,153 \\ \hline Selling and marketingexpenses & 30 & (98,877,562) \\ \hline General and adm in istrative expenses & 31 & (274,971,694) \\ \hline \multicolumn{2}{|l|}{ Operating profit } & 621,928.897 \\ \hline Other income, net & 32 & 8,016,728 \\ \hline Finance cost & 33 & (8,199,051) \\ \hline Share of result of an associate & 11 & 10,449,544 \\ \hline \multicolumn{2}{|l|}{ Profitbefore zakat } & 632,196,118 \\ \hline Zakat expense & 27 & (21,734.758) \\ \hline Profit for the year & & 610,461,360 \\ \hline \multirow{2}{*}{\multicolumn{3}{|c|}{\begin{tabular}{l} Other comprehensive income \\ tems that will not be reclassified to profir or loss: \end{tabular}}} \\ \hline & & \\ \hline \multirow{2}{*}{\multicolumn{3}{|c|}{\begin{tabular}{l} Re-measurement loss on employees' end-of-service \\ benefits obligations \end{tabular}}} \\ \hline & & \\ \hline \multirow{2}{*}{\multicolumn{2}{|c|}{\begin{tabular}{l} Other comprehensive loss for the year \\ Total comprehensive income for the year \end{tabular}}} & (3,732,365) \\ \hline & & 606,728,995 \\ \hline \multicolumn{3}{|l|}{ Profit for the year attributable to: } \\ \hline \multicolumn{2}{|l|}{ Shareholders of the Company } & 578,161,353 \\ \hline \multicolumn{2}{|l|}{ Non-controlling interest } & 32,300,007 \\ \hline \multicolumn{2}{|l|}{ Profit for the year } & 610.461360 \\ \hline \multicolumn{3}{|l|}{ Total comprehensive income for the year attributable to: } \\ \hline \multicolumn{2}{|l|}{ Shareholders of the Company } & 575,051,832 \\ \hline \multicolumn{2}{|l|}{ Non-controlling interest } & 31.677,163 \\ \hline \multicolumn{2}{|l|}{ Total comprehensive income for the year } & 606,728,995 \\ \hline \multicolumn{3}{|l|}{ Earnings per share: } \\ \hline \begin{tabular}{l} Basic and diluted eamings per share for profit attributable to \\ the shareholders of the Company \end{tabular} & 34 & 5.78 \\ \hline \end{tabular} Balance at 1 January 2021 Total comprehensive income for the year Profit for the year Other comprehensive loss forthe year Total comprehensive income for the year Transactions with owners in their capacity as owners Dividend Dividend to non-controlling interests Balance at 31 December 2021 \begin{tabular}{|c|c|c|} \hline \multicolumn{3}{|l|}{ Cash flews frem financing astivities } \\ \hline Cash flows from financing activities & & \\ \hline Dividend paid & 19 & (250,000,000) \\ \hline Proceeds from term loans & 22 & 235,000,000 \\ \hline Repayment of term loans & 22 & (184,215,514) \\ \hline Payment of lease liabilities & & (6,898,371) \\ \hline Dividend paid to non-controlling interests in subsidiary & & (34,300,000) \\ \hline \begin{tabular}{l} Proceeds from liquidation of subsidiary to non-controlling \\ interest \end{tabular} & & \\ \hline Net cash outflow from financing activities & & (240,413,885) \\ \hline Net decrease in cash and cash equivalents & & (3,284,623) \\ \hline Cash and cash equivalents at beginning of the year & & 160,153,411 \\ \hline Cash and cash equivalents at the end of the year & 17 & 156,868,788 \\ \hline Non- & & \\ \hline Finance cost capitalized & 7.3 & 8,319,717 \\ \hline \begin{tabular}{l} Transfer from advances to contractors to property and \\ equipment \end{tabular} & 12 & 35.459,818 \\ \hline \end{tabular}
Step by Step Solution
There are 3 Steps involved in it

Get step-by-step solutions from verified subject matter experts