

Question: Required information Chapter 0 7 Applying Tableau ( Static ) Analyzing Sell - or - Process - Further Decision [ L 0 7 - 2
Required information
Chapter Applying Tableau Static Analyzing SellorProcessFurther Decision L L
The following information applies to the questions displayed below.
To complete this exercise, you will need to download and install Tableau on your computer. Tableau provides free
instructor and student licenses as well as free videos and support for utilizing and learning the software. Once you are up
and running with Tableau, watch the three "Getting Started" Tableau videos. All of Tableau's short training videos can be
found here.
Flanagan Audio currently produces a high quality yet affordable stereo speaker. They have been introduced to some new
technology that allows them to bass boost the speaker they currently produce, yet at a greater production cost. They have
provided you vital details comparing the difference the bass boost would have on their profits under two different demand
scenarios.
Scenario A indicates current projected demand at units while Scenario B indicates an increased demand at
units. The regular speaker sells at $ per unit while the bass boosted speaker sells at $ per unit.
Download the Excel file, which you will use to create the Tableau visualizations requested by the company.
Upload the Excel file into Tableau by doing the following:
Open the Tableau Desktop application.
On the lefthand side, under the "Connect" header and the To a file" subheader, click on "Microsoft Excel."
Choose the Excel file and click "Open."
Since the only worksheet in the Excel File is it will default as a selection with no further import steps needed.
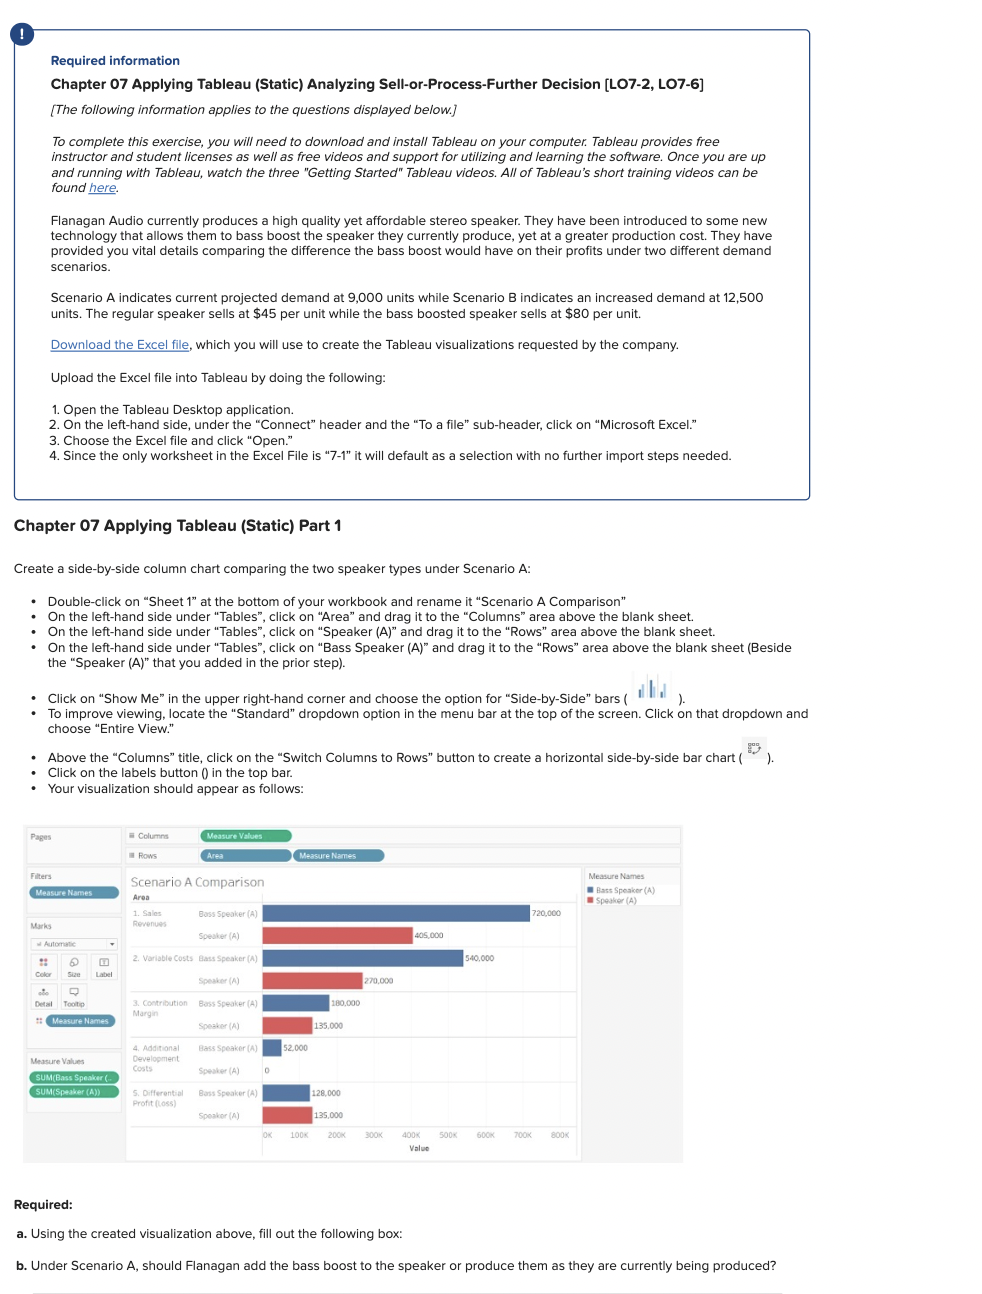
Chapter Applying Tableau Static Part
Create a sidebyside column chart comparing the two speaker types under Scenario A:
Doubleclick on "Sheet at the bottom of your workbook and rename it "Scenario A Comparison"
On the lefthand side under "Tables", click on "Area" and drag it to the "Columns" area above the blank sheet.
On the lefthand side under "Tables", click on "Speaker A and drag it to the "Rows" area above the blank sheet.
On the lefthand side under "Tables", click on "Bass Speaker A and drag it to the "Rows" area above the blank sheet Beside
the "Speaker A that you added in the prior step
Click on "Show Me in the upper righthand corner and choose the option for "SidebySide" bars II I
To improve viewing, locate the "Standard" dropdown option in the menu bar at the top of the screen. Click on that dropdown and
choose "Entire View."
Above the "Columns" title, click on the "Switch Columns to Rows" button to create a horizontal sidebyside bar chart
Click on the labels button in the top bar.
Your visualization should appear as follows:
Required:
a Using the created visualization above, fill out the following box:
b Under Scenario A should Flanagan add the bass boost to the speaker or produce them as they are currently being produced?
Step by Step Solution
There are 3 Steps involved in it
1 Expert Approved Answer
Step: 1 Unlock

Question Has Been Solved by an Expert!
Get step-by-step solutions from verified subject matter experts
Step: 2 Unlock
Step: 3 Unlock