

Question: ! Required information CP5-3 (Static) Comparing Companies within an Industry LO-5-4 [The following information applies to the questions displayed below.) Refer to the financial statements
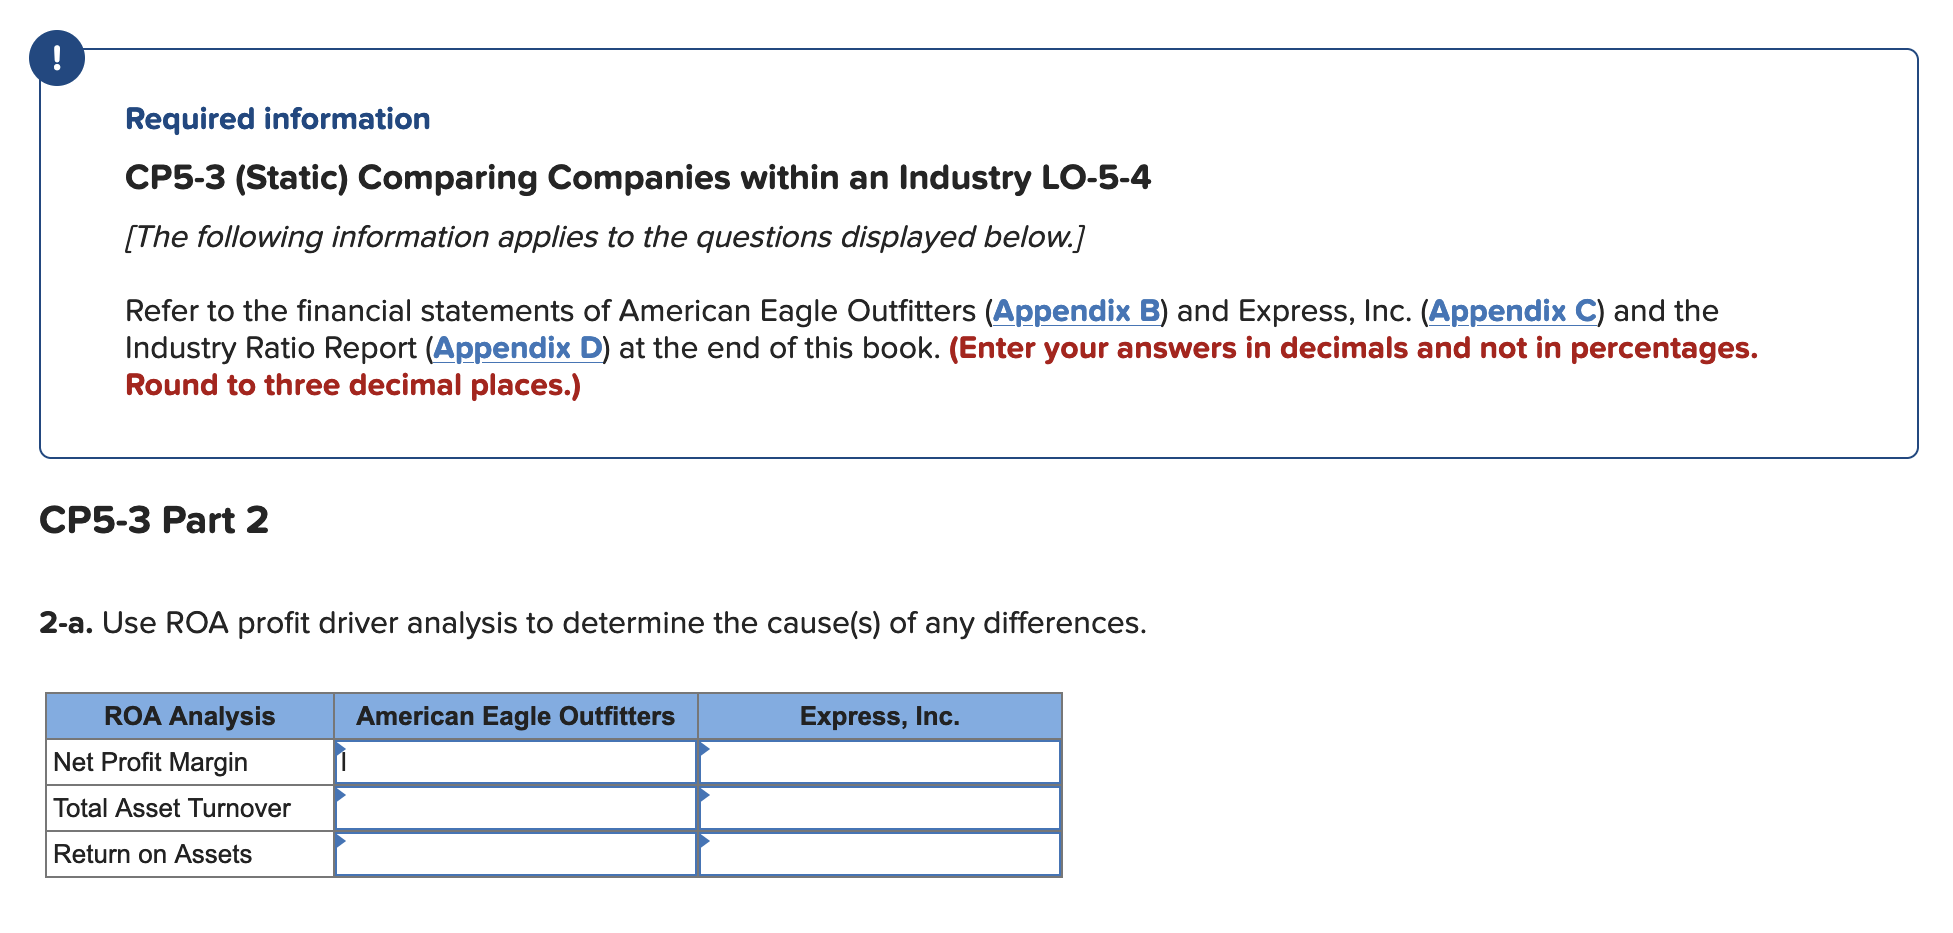
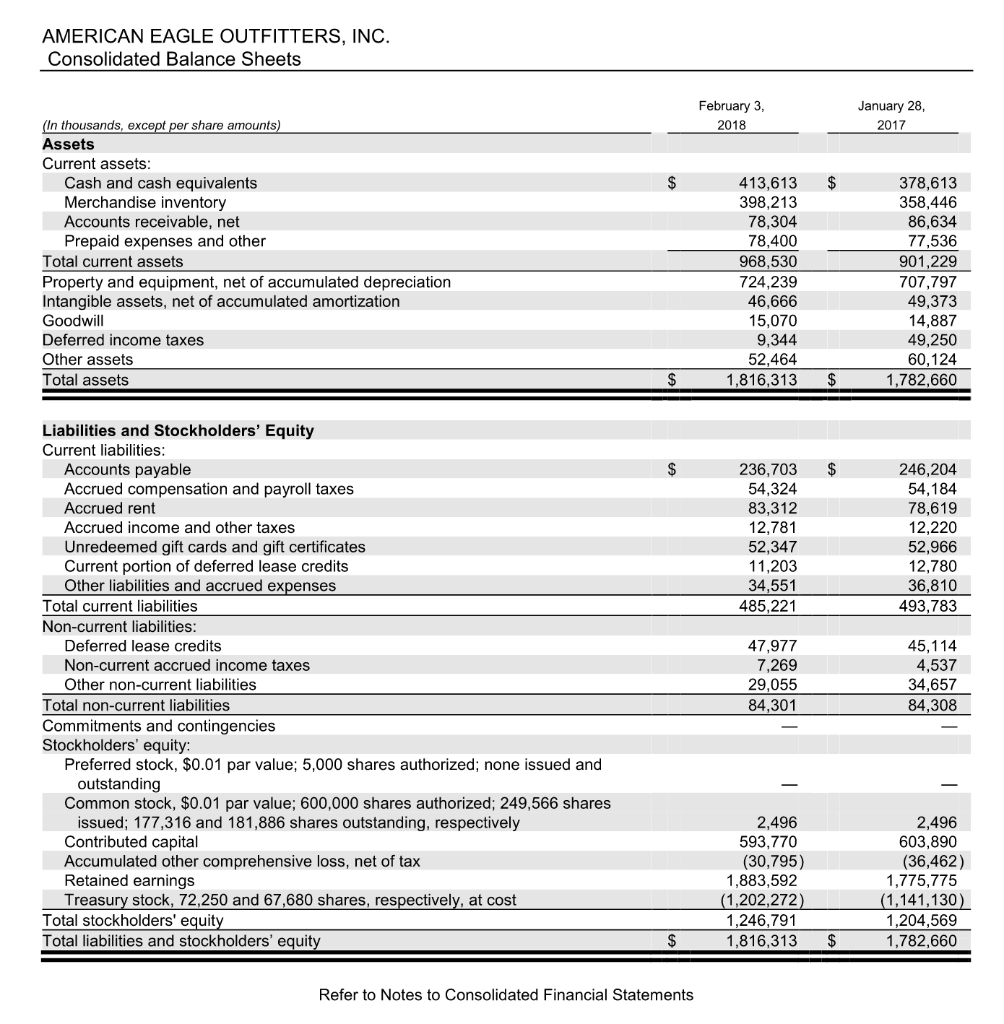
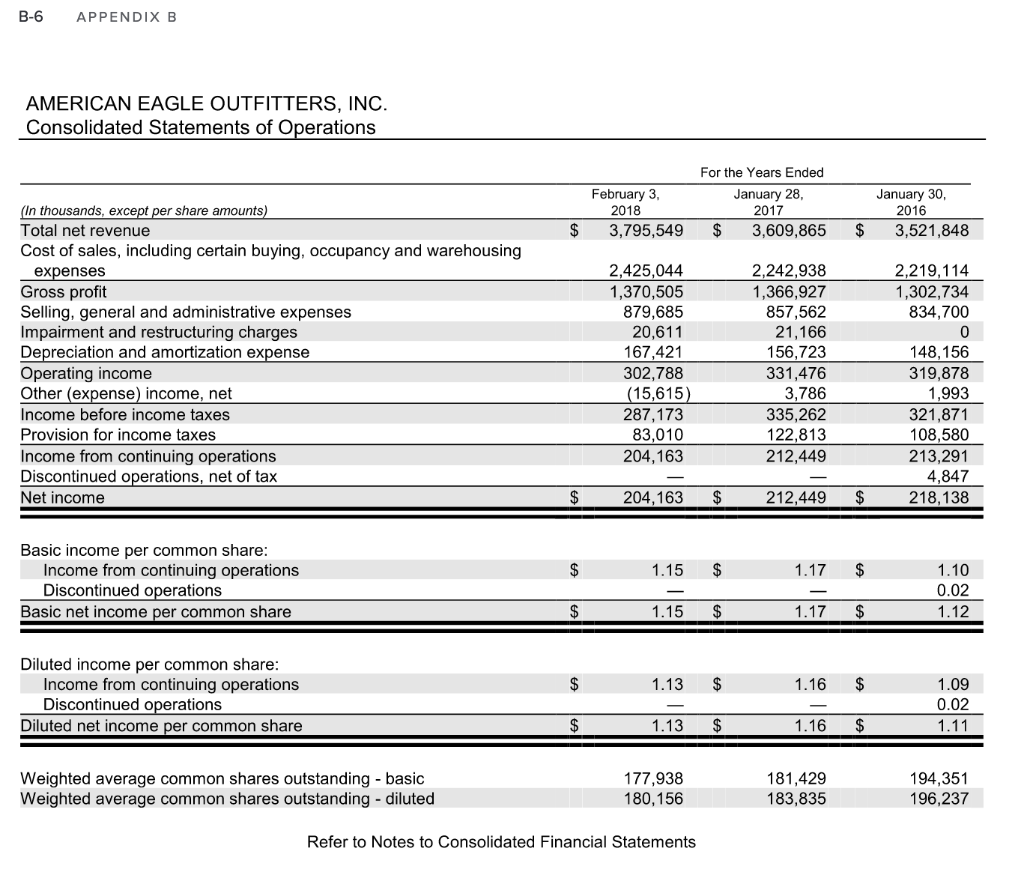
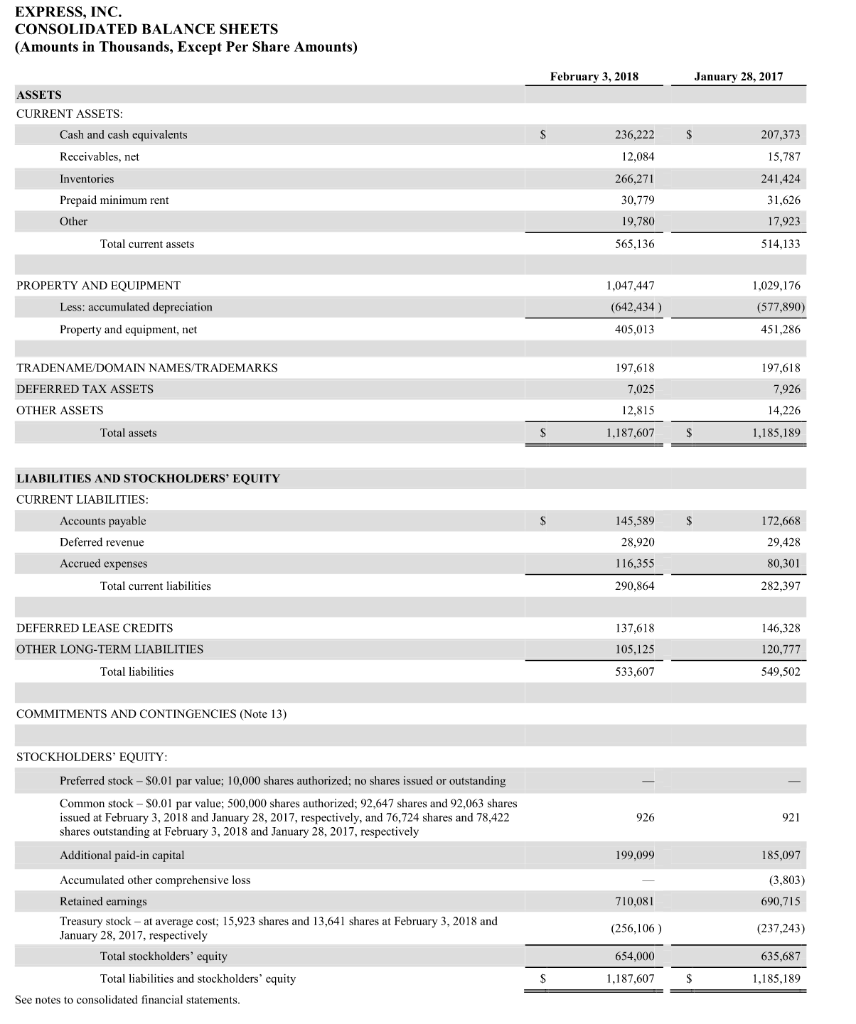
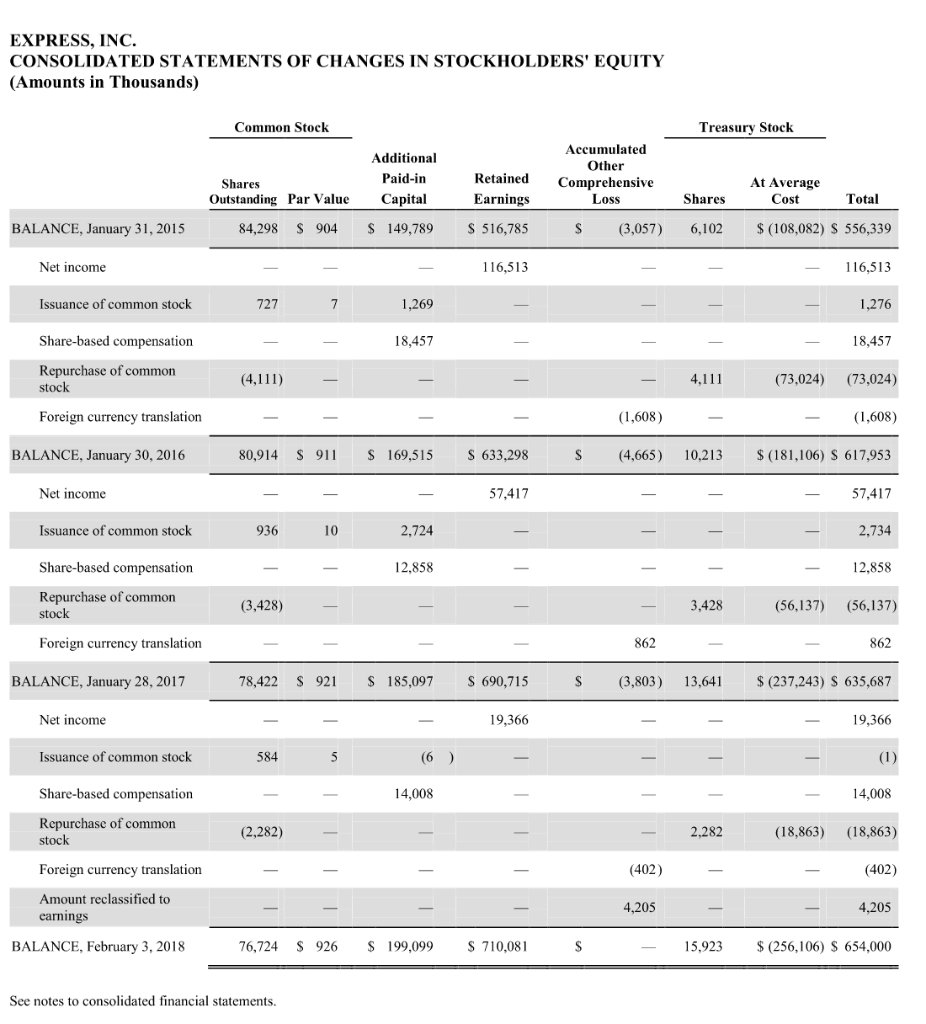
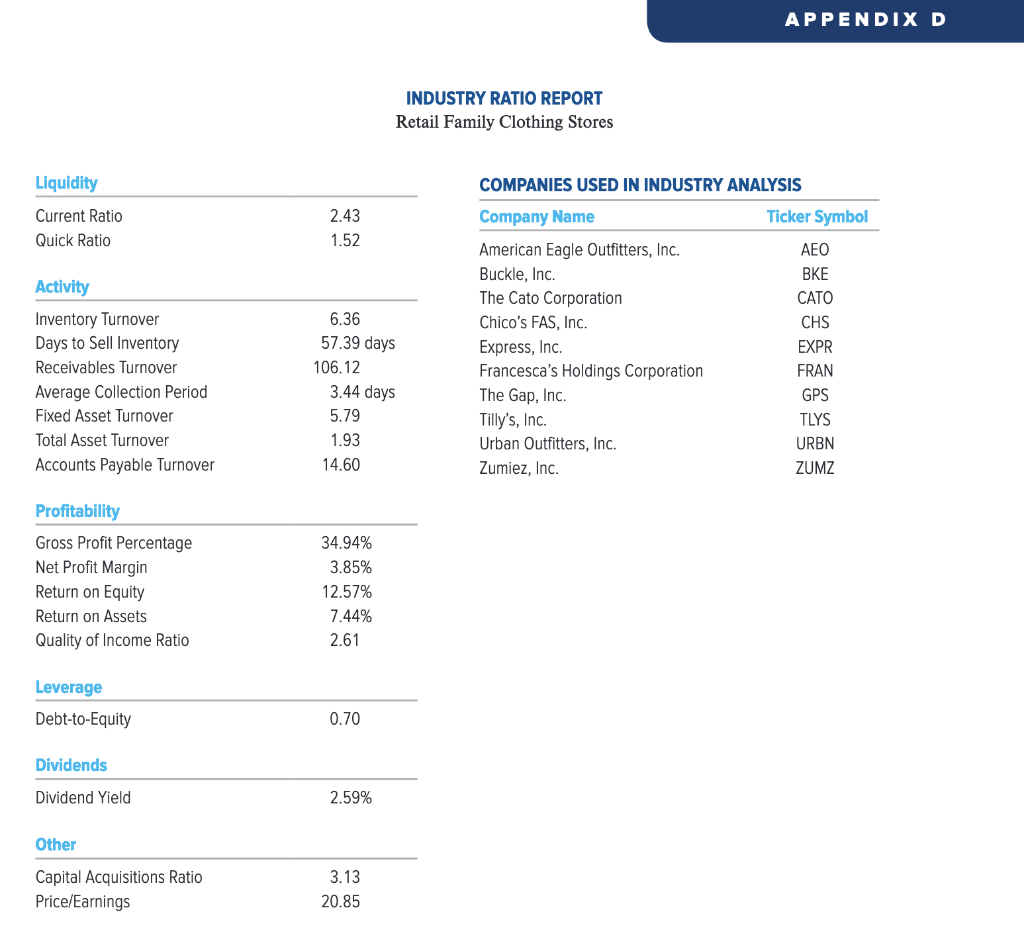
! Required information CP5-3 (Static) Comparing Companies within an Industry LO-5-4 [The following information applies to the questions displayed below.) Refer to the financial statements of American Eagle Outfitters (Appendix B) and Express, Inc. (Appendix C) and the Industry Ratio Report (Appendix D) at the end of this book. (Enter your answers in decimals and not in percentages. Round to three decimal places.) CP5-3 Part 2 2-a. Use ROA profit driver analysis to determine the cause(s) of any differences. American Eagle Outfitters Express, Inc. ROA Analysis Net Profit Margin Total Asset Turnover Return on Assets AMERICAN EAGLE OUTFITTERS, INC. Consolidated Balance Sheets February 3, 2018 January 28, 2017 (In thousands, except per share amounts) Assets Current assets: Cash and cash equivalents Merchandise inventory Accounts receivable, net Prepaid expenses and other Total current assets Property and equipment, net of accumulated depreciation Intangible assets, net of accumulated amortization Goodwill Deferred income taxes Other assets Total assets 413,613 398,213 78,304 78,400 968,530 724,239 46,666 15,070 9,344 52,464 1,816,313 378,613 358,446 86,634 77,536 901,229 707,797 49,373 14,887 49,250 60,124 1,782,660 $ $ $ 236,703 54,324 83,312 12,781 52,347 11,203 34,551 485,221 246,204 54,184 78,619 12,220 52,966 12,780 36,810 493,783 Liabilities and Stockholders' Equity Current liabilities: Accounts payable Accrued compensation and payroll taxes Accrued rent Accrued income and other taxes Unredeemed gift cards and gift certificates Current portion of deferred lease credits Other liabilities and accrued expenses Total current liabilities Non-current liabilities: Deferred lease credits Non-current accrued income taxes Other non-current liabilities Total non-current liabilities Commitments and contingencies Stockholders' equity: Preferred stock, $0.01 par value; 5,000 shares authorized; none issued and outstanding Common stock, $0.01 par value; 600,000 shares authorized; 249,566 shares issued; 177,316 and 181,886 shares outstanding, respectively Contributed capital Accumulated other comprehensive loss, net of tax Retained earnings Treasury stock, 72,250 and 67,680 shares, respectively, at cost Total stockholders' equity Total liabilities and stockholders' equity 47,977 7,269 29,055 84,301 45,114 4,537 34,657 84,308 2,496 593,770 (30,795) 1,883,592 (1,202,272) 1,246,791 1,816,313 2,496 603,890 (36,462) 1,775,775 (1,141,130) 1,204,569 1,782,660 $ $ Refer to Notes to Consolidated Financial Statements B-6 APPENDIX B AMERICAN EAGLE OUTFITTERS, INC. Consolidated Statements of Operations February 3, 2018 3,795,549 For the Years Ended January 28, 2017 $ 3,609,865 January 30, 2016 3,521,848 $ $ (In thousands, except per share amounts) Total net revenue Cost of sales, including certain buying, occupancy and warehousing expenses Gross profit Selling, general and administrative expenses Impairment and restructuring charges Depreciation and amortization expense Operating income Other (expense) income, net Income before income taxes Provision for income taxes Income from continuing operations Discontinued operations, net of tax Net income 2,425,044 1,370,505 879,685 20,611 167,421 302,788 (15,615) 287,173 83,010 204,163 2,242,938 1,366,927 857,562 21,166 156,723 331,476 3,786 335,262 122,813 212,449 2,219,114 1,302,734 834,700 0 148, 156 319,878 1,993 321,871 108,580 213,291 4,847 218,138 $ 204,163 $ 212,449 $ $ 1.15 $ 1.17 $ Basic income per common share: Income from continuing operations Discontinued operations Basic net income per common share 1.10 0.02 1.12 $ 1.15 $ 1.17 $ $ 1.13 $ 1.16 $ Diluted income per common share: Income from continuing operations Discontinued operations Diluted net income per common share 1.09 0.02 1.11 $ 1.13 $ 1.16 $ Weighted average common shares outstanding - basic Weighted average common shares outstanding - diluted 177,938 180, 156 181,429 183,835 194,351 196,237 Refer to Notes to Consolidated Financial Statements EXPRESS, INC. CONSOLIDATED BALANCE SHEETS (Amounts in Thousands, Except Per Share Amounts) February 3, 2018 3 January 28, 2017 S $ 207,373 ASSETS CURRENT ASSETS: Cash and cash equivalents Receivables, net Inventories Prepaid minimum rent Other 236,222 12,084 266,271 30,779 19,780 565,136 15,787 241,424 31,626 17,923 Total current assets 514,133 PROPERTY AND EQUIPMENT Less: accumulated depreciation Property and equipment, net 1,047,447 (642,434) 405,013 1,029,176 (577,890) 451,286 197,618 7,025 197,618 7,926 TRADENAME/DOMAIN NAMES/TRADEMARKS DEFERRED TAX ASSETS OTHER ASSETS Total assets 12,815 1.187,607 14,226 1,185,189 S S S S 172,668 LIABILITIES AND STOCKHOLDERS' EQUITY CURRENT LIABILITIES: : Accounts payable Deferred revenue Accrued expenses Total current liabilities 145,589 28,920 116.355 29,428 80,301 290,864 282.397 146,328 DEFERRED LEASE CREDITS OTHER LONG-TERM LIABILITIES Total liabilities 137,618 105,125 120,777 533,607 549,502 COMMITMENTS AND CONTINGENCIES (Note 13) ) 926 921 199,099 185,097 STOCKHOLDERS' EQUITY: Preferred stock - S0.01 par value; 10,000 shares authorized; no shares issued or outstanding Common stock - $0.01 par value; 500,000 shares authorized; 92,647 shares and 92,063 shares issued at February 3, 2018 and January 28, 2017, respectively, and 76,724 shares and 78,422 shares outstanding at February 3, 2018 and January 28, 2017, respectively Additional paid-in capital Accumulated other comprehensive loss Retained earnings Treasury stock - at average cost; 15,923 shares and 13,641 shares at February 3, 2018 and January 28, 2017, respectively Total stockholders' equity ' Total liabilities and stockholders' equity See notes to consolidated financial statements. (3,803) 710,081 690,715 (256,106 (237,243) 654,000 635,687 S 1.187.607 S 1,185,189 EXPRESS, INC. CONSOLIDATED STATEMENTS OF CHANGES IN STOCKHOLDERS' EQUITY (Amounts in Thousands) Common Stock Treasury Stock Additional Paid-in Capital Shares Outstanding Par Value Accumulated Other Comprehensive Loss Retained Earnings At Average Cost Shares Total BALANCE, January 31, 2015 84,298 S 904 $ 149,789 S 516,785 S (3,057) 6,102 $ (108,082) $ 556,339 Net income 116,513 116,513 Issuance of common stock 727 7 1,269 1,276 Share-based compensation 18,457 18,457 Repurchase of common stock (4,111) 4,111 (73,024) (73,024) Foreign currency translation (1,608) (1,608) BALANCE, January 30, 2016 80,914 S 911 $ 169,515 S 633,298 S (4,665) 10.213 $ (181,106) S 617,953 Net income 57,417 57,417 Issuance of common stock 936 10 2.724 2,734 Share-based compensation 12.858 12,858 Repurchase of common stock (3,428) 3,428 (56,137) (56,137) Foreign currency translation 862 862 BALANCE, January 28, 2017 78,422 $ 921 $ 185,097 S 690,715 S (3,803) 13,641 $ (237,243) S 635,687 Net income 19,366 19,366 Issuance of common stock 584 5 (6 ) (1) Share-based compensation 14,008 14.008 Repurchase of common stock (2,282) 2.282 (18,863) (18,863) Foreign currency translation (402) (402) Amount reclassified to earnings 4,205 4,205 BALANCE, February 3, 2018 76,724 $ 926 $ 199,099 S 710,081 S 15,923 $ (256,106) S 654,000 See notes to consolidated financial statements. APPENDIX D INDUSTRY RATIO REPORT Retail Family Clothing Stores Liquidity Current Ratio Quick Ratio 2.43 1.52 Activity Inventory Turnover Days to Sell Inventory Receivables Turnover Average Collection Period Fixed Asset Turnover Total Asset Turnover Accounts Payable Turnover 6.36 57.39 days 106.12 3.44 days 5.79 COMPANIES USED IN INDUSTRY ANALYSIS Company Name Ticker Symbol American Eagle Outfitters, Inc. AEO Buckle, Inc. BKE The Cato Corporation CATO Chico's FAS, Inc. CHS Express, Inc. EXPR Francesca's Holdings Corporation FRAN The Gap, Inc. GPS Tilly's, Inc. TLYS Urban Outfitters, Inc. URBN Zumiez, Inc. ZUMZ 1.93 14.60 Profitability Gross Profit Percentage Net Profit Margin Return on Equity Return on Assets Quality of Income Ratio 34.94% 3.85% 12.57% 7.44% 2.61 Leverage Debt-to-Equity 0.70 Dividends Dividend Yield 2.59% Other Capital Acquisitions Ratio Price/Earnings 3.13 20.85
Step by Step Solution
There are 3 Steps involved in it

Get step-by-step solutions from verified subject matter experts