

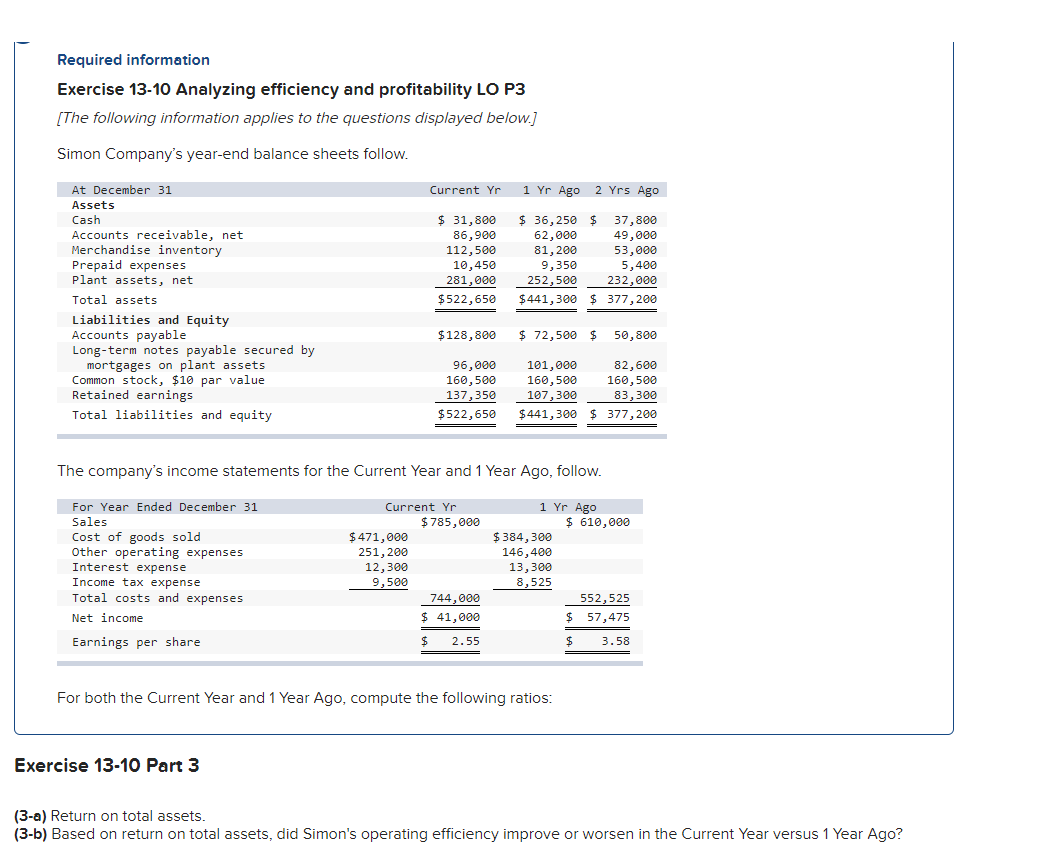
Question: Required information Exercise 13-10 Analyzing efficiency and profitability LO P3 [The following information applies to the questions displayed below.] Simon Company's year-end balance sheets follow.
![following information applies to the questions displayed below.] Simon Company's year-end balance](https://dsd5zvtm8ll6.cloudfront.net/si.experts.images/questions/2024/09/66e88efb77c0c_98766e88efb1c0ec.jpg)
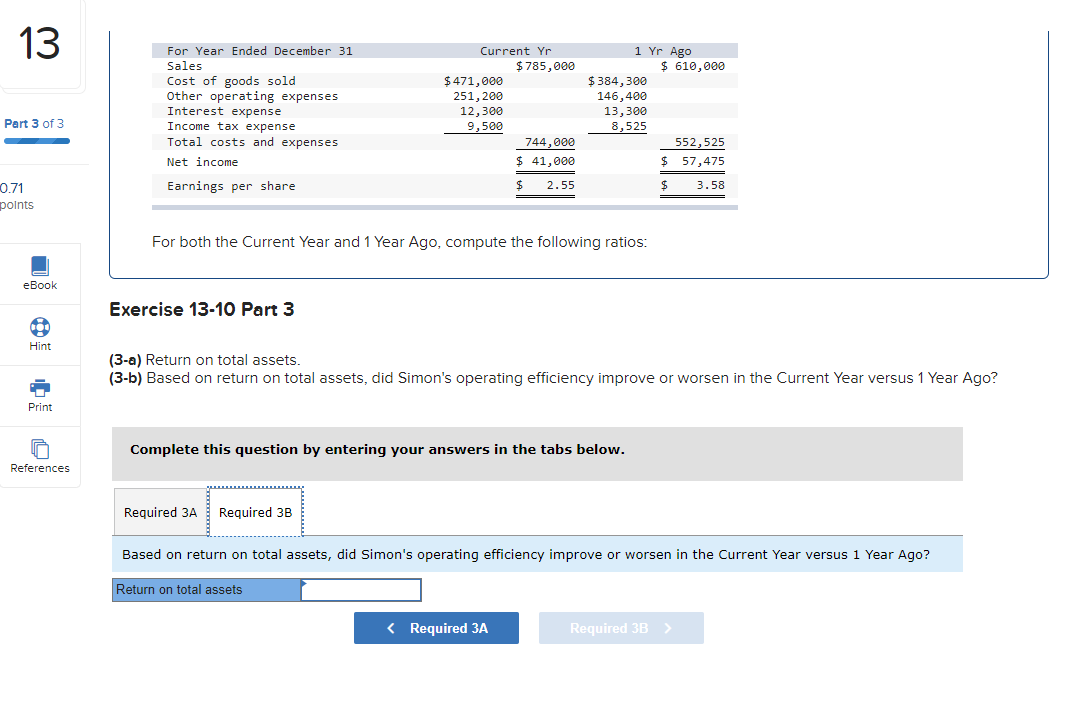
Required information Exercise 13-10 Analyzing efficiency and profitability LO P3 [The following information applies to the questions displayed below.] Simon Company's year-end balance sheets follow. Current Yr 1 Yr Ago 2 Yrs Ago At December 31 Assets Cash Accounts receivable, net Merchandise inventory Prepaid expenses Plant assets, net Total assets Liabilities and Equity Accounts payable Long-term notes payable secured by mortgages on plant assets Common stock, $10 par value Retained earnings Total liabilities and equity $ 31,800 86,900 112,500 10,450 281,000 $ 522,650 $ 36,250 $ 37,800 62,000 49,000 81,200 53,000 9,350 5,400 252,500 232,000 $441,300 $ 377,200 $ 128,800 $ 72,500 $ 50,800 96,000 160,500 137, 350 $ 522,650 101,000 160,500 107,300 $441,300 82,600 160,500 83,300 377,200 The company's income statements for the Current Year and 1 Year Ago, follow. For Year Ended December 31 Sales Cost of goods sold Other operating expenses Interest expense Income tax expense Total costs and expenses Net income Earnings per share Current Yr $ 785,000 $ 471,000 251,200 12,300 9,500 744,000 $ 41,000 $ 2.55 1 Yr Ago $ 610,000 $384,300 146,400 13,300 8,525 552,525 57,475 $ 3.58 For both the Current Year and 1 Year Ago, compute the following ratios: Exercise 13-10 Part 3 (3-a) Return on total assets. (3-b) Based on return on total assets, did Simon's operating efficiency improve or worsen in the Current Year versus 1 Year Ago? 13 251,200 12,300 9,500 146,400 13,300 8,525 Other operating expenses Interest expense Income tax expense Total costs and expenses Net income Earnings per share 744,000 $ 41,000 552,525 $ 57,475 $ 3.58 Part 3 of 3 $ 2.55 For both the Current Year and 1 Year Ago, compute the following ratios: 0.71 points Exercise 13-10 Part 3 eBook (3-a) Return on total assets. (3-b) Based on return on total assets, did Simon's operating efficiency improve or worsen in the Current Year versus 1 Year Ago? Hint Complete this question by entering your answers in the tabs below. Print Required 3A Required 3B References Return on total assets Return On Total Assets Choose Numerator: 1 Choose Denominator: Return On Total Assets Return on total assets Current Year: % 1 ! 1 Year Ago: % 13 For Year Ended December 31 Sales Cost of goods sold Other operating expenses Interest expense Income tax expense Total costs and expenses Net income Earnings per share Current Yr $ 785,000 $ 471,000 251,200 12,300 9,500 744,000 $ 41,000 Part 3 of 3 1 Yr Ago $ 610,000 $384,300 146,400 13,300 8,525 552,525 $ 57,475 $ 3.58 $ 2.55 0.71 points For both the Current Year and 1 Year Ago, compute the following ratios: eBook Exercise 13-10 Part 3 Hint (3-a) Return on total assets. (3-b) Based on return on total assets, did Simon's operating efficiency improve or worsen in the Current Year versus 1 Year Ago? Print Complete this question by entering your answers in the tabs below. References Required 3A Required 3B Based on return on total assets, did Simon's operating efficiency improve or worsen in the Current Year versus 1 Year Ago? Return on total assets
Step by Step Solution
There are 3 Steps involved in it

Get step-by-step solutions from verified subject matter experts