

Question: Required information Exercise 13-9 Analyzing risk and capital structure LO P3 (The following information applies to the questions displayed below.] Simon Company's year-end balance sheets
![(The following information applies to the questions displayed below.] Simon Company's year-end](https://s3.amazonaws.com/si.experts.images/answers/2024/09/66df73c64a786_19766df73c5dbec2.jpg)
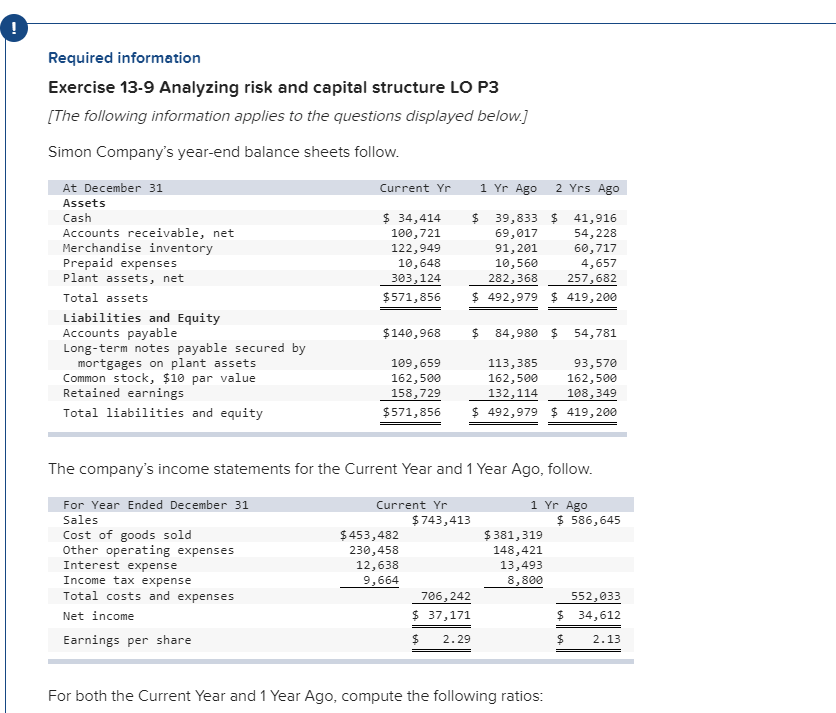
Required information Exercise 13-9 Analyzing risk and capital structure LO P3 (The following information applies to the questions displayed below.] Simon Company's year-end balance sheets follow. Current Yr 1 Yr Ago 2 Yrs Ago At December 31 Assets Cash Accounts receivable, net Merchandise inventory Prepaid expenses Plant assets, net Total assets Liabilities and Equity Accounts payable Long-term notes payable secured by mortgages on plant assets Common stock, $10 par value Retained earnings Total liabilities and equity $ 34,414 100,721 122,949 10,648 303, 124 $571,856 $ 39,833 $ 41,916 69,017 54,228 91,201 60,717 10,560 4,657 282,368 257,682 $ 492,979 $ 419,200 $140,968 $ 84,980 $ 54,781 109,659 162,500 158,729 $571,856 113,385 93,570 162,500 162,500 132,114 108,349 $ 492,979 $ 419,200 The company's income statements for the Current Year and 1 Year Ago, follow. For Year Ended December 31 Sales Cost of goods sold Other operating expenses Interest expense Income tax expense Total costs and expenses Net income Earnings per share Current Yr $ 743,413 $ 453,482 230,458 12,638 9,664 706, 242 $ 37,171 $ 2.29 1 Yr Ago $ 586,645 381,319 148,421 13,493 8,800 552,033 $ 34,612 $ 2.13 For both the Current Year and 1 Year Ago, compute the following ratios: (1) Debt and equity ratios. Debt Ratio 1 Choose Numerator: Choose Denominator: = Debt Ratio Debt ratio Current Year: 1 Year Ago: Equity Ratio Choose Numerator: 1 Choose Denominator: = | = Equity Ratio Equity ratio Current Year: 1 Year Ago
Step by Step Solution
There are 3 Steps involved in it

Get step-by-step solutions from verified subject matter experts