

Question: Required information Problem 13-2A (Algo) Ratios, common-size statements, and trend percents LO P1, P2, P3 [The following information applies to the questions displayed below.] Selected
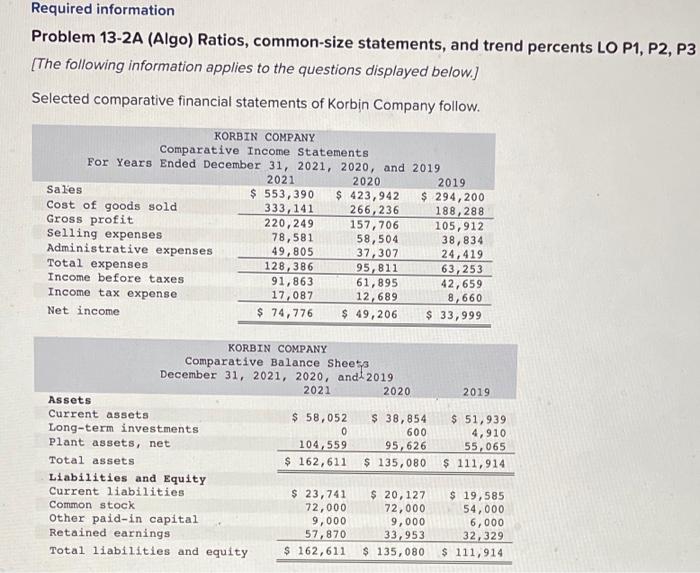
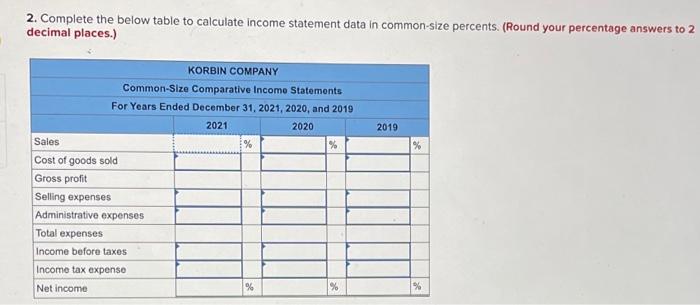
Required information Problem 13-2A (Algo) Ratios, common-size statements, and trend percents LO P1, P2, P3 [The following information applies to the questions displayed below.] Selected comparative financial statements of Korbin Company follow. KORBIN COMPANY Comparative Income Statements For Years Ended December 31, 2021, 2020, and 2019 2021 2020 2019 Sales $ 553, 390 $ 423,942 $ 294,200 Cost of goods sold 333, 141 266,236 188,288 Gross profit 220, 249 157,706 105,912 Selling expenses 78,581 58,504 38,834 Administrative expenses 49,805 37,307 24,419 Total expenses 128, 386 95,811 63,253 Income before taxes 91,863 61,895 42,659 Income tax expense 17,087 12,689 8,660 Net income $ 74,776 $ 49,206 $ 33,999 2019 KORBIN COMPANY Comparative Balance Sheets December 31, 2021, 2020, and 2019 2021 2020 Assets Current assets $ 58,052 $ 38,854 Long-term investments 0 600 Plant assets, net 104,559 95,626 Total assets $ 162,611 $ 135,080 Liabilities and Equity Current liabilities $ 23,741 $ 20,127 Common stock 72,000 72,000 Other paid-in capital 9,000 9,000 Retained earnings 57,870 33,953 Total liabilities and equity $ 162,611 $ 135,080 $ 51,939 4,910 55,065 $ 111,914 $ 19,585 54,000 6,000 32, 329 $ 111,914 2. Complete the below table to calculate income statement data in common-size percents. (Round your percentage answers to 2 decimal places.) 2019 % KORBIN COMPANY Common-Size Comparative Income Statements For Years Ended December 31, 2021, 2020, and 2019 2021 2020 Sales % % Cost of goods sold Gross profit Selling expenses Administrative expenses Total expenses Income before taxes Income tax expenso Net income % %
Step by Step Solution
There are 3 Steps involved in it

Get step-by-step solutions from verified subject matter experts