

Question: Required information Problem 13-2A Ratios, common-size statements, and trend percents LO P1, P2, P3 [The following information applies to the questions displayed below.) Selected comparative
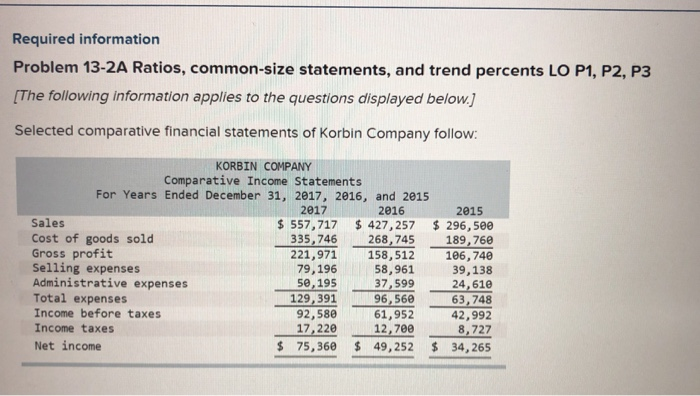
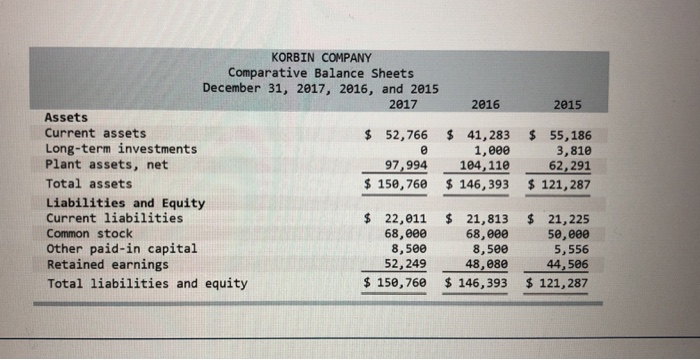
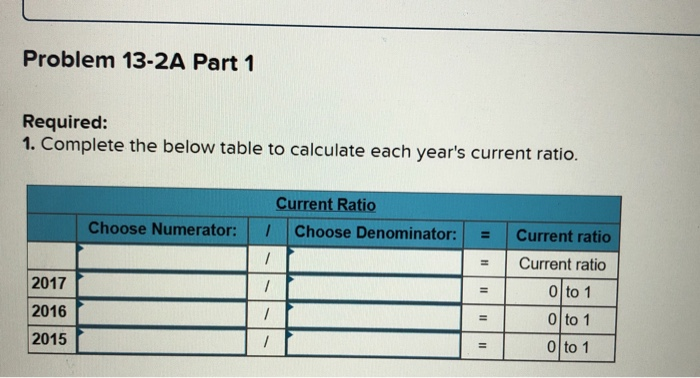
Required information Problem 13-2A Ratios, common-size statements, and trend percents LO P1, P2, P3 [The following information applies to the questions displayed below.) Selected comparative financial statements of Korbin Company follow: KORBIN COMPANY Comparative Income Statements For Years Ended December 31, 2017, 2016, and 2015 2017 2016 2015 Sales $ 557,717 $ 427,257 $ 296,500 Cost of goods sold 335, 746 268,745 189,760 Gross profit 221,971 158,512 106,740 Selling expenses 79, 196 58,961 39,138 Administrative expenses 50, 195 37,599 24,610 Total expenses 129, 391 96,560 63,748 Income before taxes 92,580 61,952 42,992 Income taxes 17,220 12,700 8,727 Net income $ 75,360 $ 49,252 $ 34,265 2015 KORBIN COMPANY Comparative Balance Sheets December 31, 2017, 2016, and 2015 2017 2016 Assets Current assets $ 52,766 $ 41,283 Long-term investments O 1,000 Plant assets, net 97,994 104, 110 Total assets $ 146,393 Liabilities and Equity Current liabilities $ 22,011 $ 21,813 Common stock 68,000 68,000 Other paid-in capital 8,500 8,500 Retained earnings 52,249 48,080 Total liabilities and equity $ 150,760 $ 146,393 $ 55,186 3,810 62,291 $ 121,287 $ 21, 225 50,000 5,556 44,506 $ 121,287 Problem 13-2A Part 1 Required: 1. Complete the below table to calculate each year's current ratio. Current Ratio Choose Denominator: Choose Numerator: = 2017 Current ratio Current ratio 0 to 1 0 to 1 0 to 1 2016 2015
Step by Step Solution
There are 3 Steps involved in it

Get step-by-step solutions from verified subject matter experts