

Question: Selected comparative financial statements of Korbin Company follow. KORBIN COMPANY Comparative Income Statements For Years Ended December 31 Sales 2021 $385,981 2020 $295,693 2019
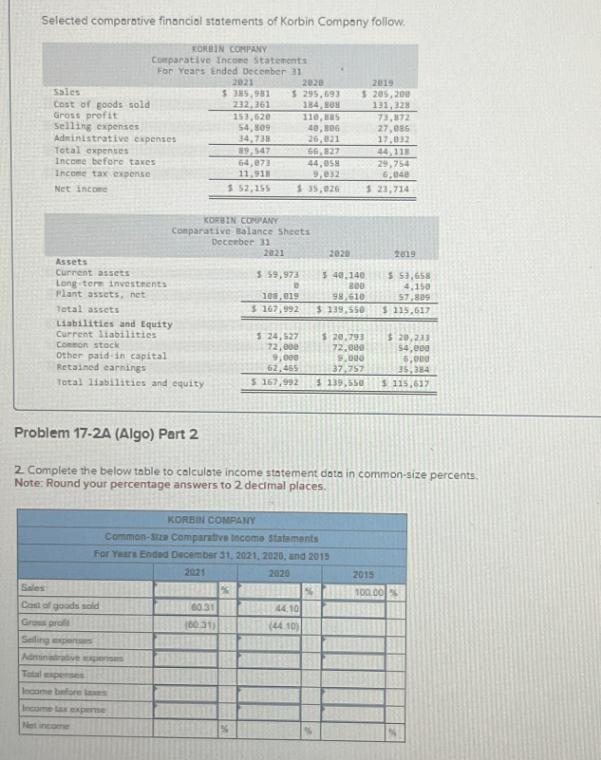
Selected comparative financial statements of Korbin Company follow. KORBIN COMPANY Comparative Income Statements For Years Ended December 31 Sales 2021 $385,981 2020 $295,693 2019 $205,200 Cost of goods sold 232,361 184,80 131,328 Gross profit 153,620 110,Bas 73,872 Selling expenses 54,809 40,806 27,086 Administrative expenses 34,738 26,021 17,032 Total expenses 89,547 66,827 44,118 Income before taxes 64,073 44,058 29,754 Income tax expense 11,918 9,032 6,048 Net income $ 52,155 $ 35,026 $23,714 KORBIN COMPANY Comparative Balance Sheets Assets Current assets Long term investments Plant assets, net Total assets Liabilities and Equity Current liabilities Common stock Other paid-in capital Retained earnings Total liabilities and equity December 31 2021 $ 59,973 D 108,019 $167,992 2020 $ 40.140) 800 98,610 $ 139,550 $20,793 72,000 2019 $ 53,658 4,150 57,809 $ 115,617 $ 20,213 $4,000 6,000 35,384 72,000 9,000 62,465 9.000 37.757 $167,992 $ 139,550 $ 115,617 $ 24,527 Problem 17-2A (Algo) Part 2 2. Complete the below table to calculate income statement data in common-size percents. Note: Round your percentage answers to 2 decimal places. KORBIN COMPANY Common-Size Comparative income statements For Years Ended December 31, 2021, 2020, and 2015 2021 2020 Sales Cast of goods sold H60.31 44.10 Gross prof (60.31) (44.10) Selling expenses Administrative experies Total expenses lecome before i Income tax experne Net income 2015
Step by Step Solution
There are 3 Steps involved in it

Get step-by-step solutions from verified subject matter experts