

Question: Required information Problem 17-2A Ratios, common-size statements, and trend percents LO P1, P2, P3 [The following information applies to the questions displayed below.] Selected comparative
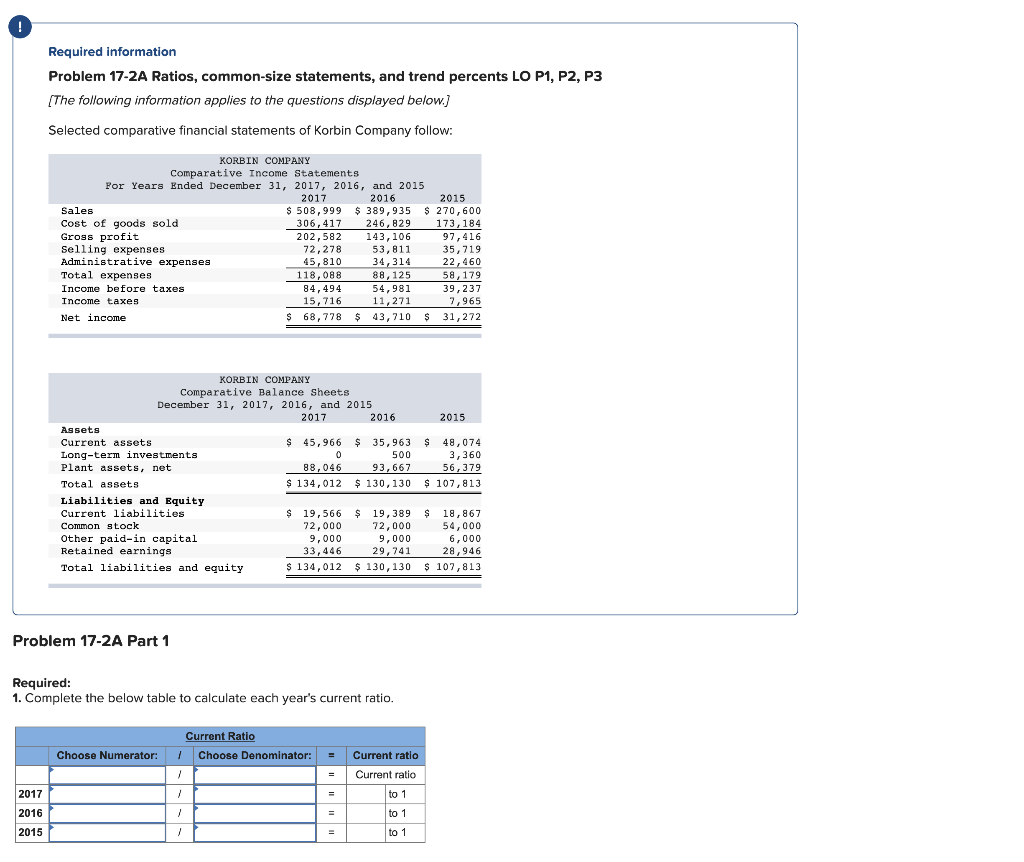
Required information Problem 17-2A Ratios, common-size statements, and trend percents LO P1, P2, P3 [The following information applies to the questions displayed below.] Selected comparative financial statements of Korbin Company follow: KORBIN COMPANY Comparative Income Statements For Years Ended December 31, 2017, 2016, and 2015 2017 2016 2015 Sales $ 508,999 $ 389,935 $ 270,600 Cost of goods sold 306, 417 246,829 173, 184 Gross profit 202,582 143, 106 97,416 Selling expenses 72,278 53, 811 35,719 Administrative expenses 45,810 34, 314 22,460 Total expenses 118,088 88 125 58,179 Income before taxes 84,494 54,981 39,237 Income taxes 15,716 11,271 7,965 Net income $ 68,778 $ 43,710 $ 31,272 2015 KORBIN COMPANY Comparative Balance Sheets December 31, 2017, 2016, and 2015 2017 2016 Assets Current assets $ 45,966 $ 35,963 Long-term investments 0 500 Plant assets, net 88,046 93,667 Total assets $ 134,012 $ 130, 130 Liabilities and Equity Current liabilities $ 19,566 $ 19,389 Common stock 72,000 72,000 Other paid-in capital 9,000 9,000 Retained earnings 33,446 29,741 Total liabilities and equity $ 134,012 $ 130, 130 $ 48,074 3,360 56,379 $ 107,813 $ 18,867 54,000 6,000 28,946 $ 107,813 Problem 17-2A Part 1 Required: 1. Complete the below table to calculate each year's current ratio. Current Ratio Choose Denominator: Choose Numerator: = Current ratio Current ratio to 1 2017 2016 2015 to 1
Step by Step Solution
There are 3 Steps involved in it

Get step-by-step solutions from verified subject matter experts