

Question: Required information Problem 17-2A Ratios, common-size statements, and trend percents LO P1, P2, P3 [The following information applies to the questions displayed below.] Selected comparative
![P1, P2, P3 [The following information applies to the questions displayed below.]](https://dsd5zvtm8ll6.cloudfront.net/si.experts.images/questions/2024/09/66f9605f23046_16666f9605ebbd7b.jpg)
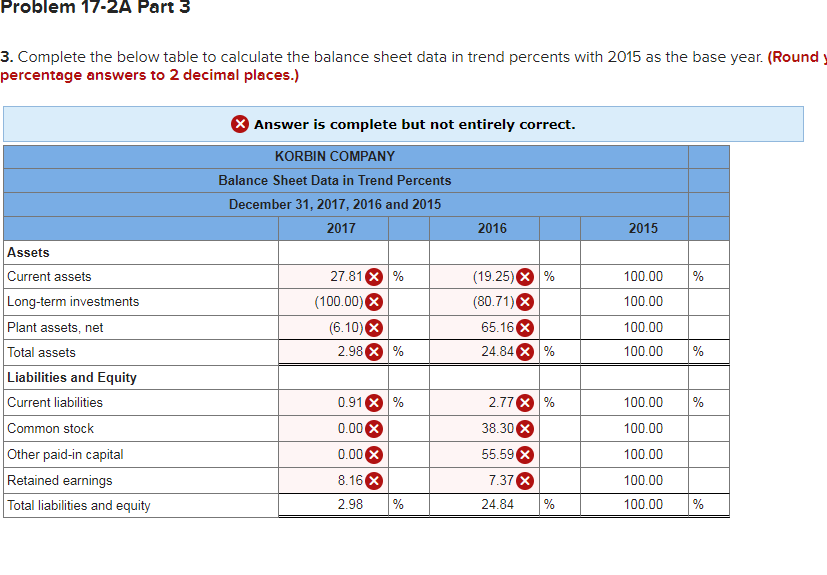
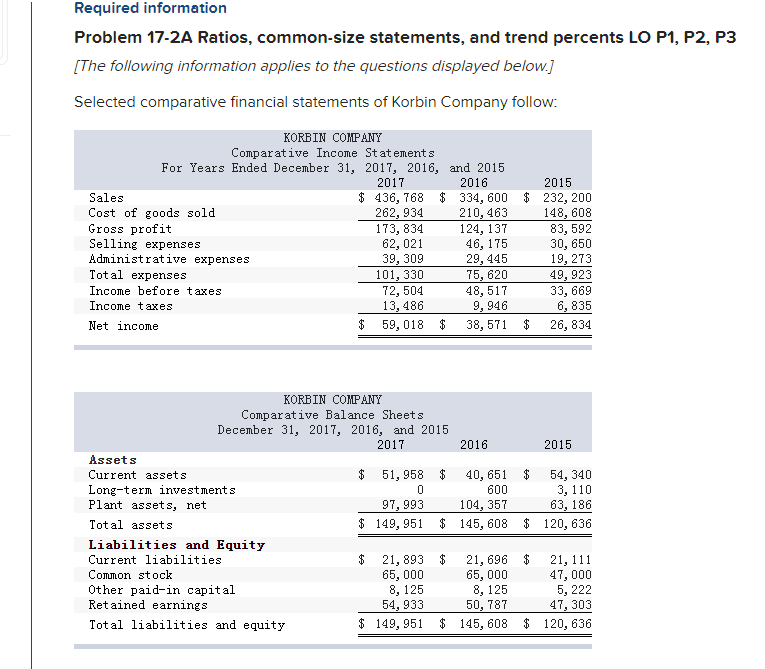
Required information Problem 17-2A Ratios, common-size statements, and trend percents LO P1, P2, P3 [The following information applies to the questions displayed below.] Selected comparative financial statements of Korbin Company follow: KORBIN COMPANY Comparative Income Statements For Years Ended December 31, 2017, 2016, and 2015 2017 2016 2015 Sales $ 436, 768 $ 334, 600 $ 232, 200 Cost of goods sold 262, 934 210, 463 148, 608 Gross profit 173, 834 124, 137 83,592 Selling expenses 62,021 46, 175 30, 650 Administrative expenses 39,309 29, 445 19,273 Total expenses 101, 330 75, 620 49, 923 Income before taxes 72,504 48,517 33, 669 Income taxes 13, 486 9,946 6, 835 Net income $ 59, 018 $ 38, 571 $ 26,834 KORBIN COMPANY Comparative Balance Sheets December 31, 2017, 2016, and 2015 2017 2016 2015 Assets Current assets $ 51, 958 $ 40, 651 $ 54, 340 Long-term investments 0 600 3, 110 Plant assets, net 97, 993 104,357 63, 186 Total assets $ 149,951 $ 145, 608 $ 120, 636 Liabilities and Equity Current liabilities $ 21,893 $ 21, 696 $ 21, 111 Common stock 65,000 65,000 47,000 Other paid-in capital 8, 125 8, 125 5, 222 Retained earnings 54, 933 50, 787 47, 303 Total liabilities and equity $ 149, 951 $ 145, 608 $ 120, 636 2. Complete the below table to calculate income statement data in common-size percents. (Round decimal places.) Answer is complete but not entirely correct. KORBIN COMPANY Common-Size Comparative Income Statements For Years Ended December 31, 2017, 2016, and 2015 2017 2016 2015 Sales 30.53% 44.10 X % 100.00 % Cost of goods sold 24.93 X 41.62 100.00 Gross profit 5.60 2.48 0.00 Selling expenses 34.32 50.65 100.00 Administrative 33.50 X 52.78 X 100.00 X expenses Total expenses 67.82 103.43 200.00 Income before taxes 49.44 X 44.10 X 100.00 X Income taxes 35.59 X 45.52 X 100.00 Net income 13.85 % (1.42) % 0.00 % Problem 17-2A Part 3 3. Complete the below table to calculate the balance sheet data in trend percents with 2015 as the base year. (Round percentage answers to 2 decimal places.) Answer is complete but not entirely correct. KORBIN COMPANY Balance Sheet Data in Trend Percents December 31, 2017, 2016 and 2015 2017 2016 2015 % 100.00 100.00 27.81 X % (100.00) (6.10) 2.98 % (19.25) X % (80.71) 65.16 24.84 % 100.00 100.00 % Assets Current assets Long-term investments Plant assets, net Total assets Liabilities and Equity Current liabilities Common stock Other paid-in capital Retained earnings Total liabilities and equity % 0.91 % 0.00 0.00 X 100.00 100.00 2.77 % 38.30 55.59 X 7.37 24.84 % 100.00 8.16 X 2.98 100.00 100.00 % %
Step by Step Solution
There are 3 Steps involved in it

Get step-by-step solutions from verified subject matter experts