

Question: Required: Prepare a scattergraph based on the store cost and revenue data. 1. On the graph below, use the point tool to plot the point
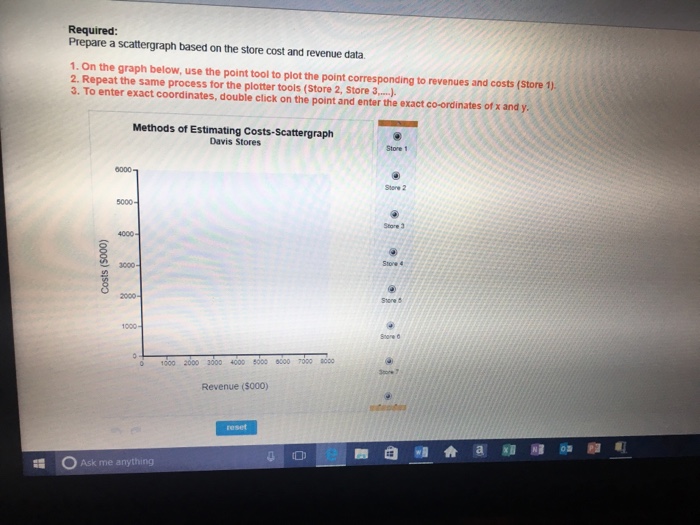
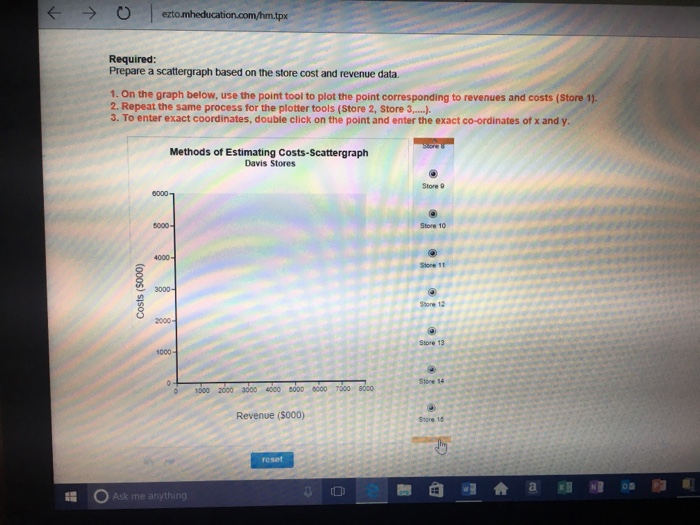
Required: Prepare a scattergraph based on the store cost and revenue data. 1. On the graph below, use the point tool to plot the point corresponding to revenues and costs (Store 1) 2. Repeat the same process for the plotter tools (Store 2, Store 3... 3. To enter exact coordinates, double click on the point and enter the exact co-ordinates of x and y. Methods of Estimating Costs Scattergraph Davis Stores Store 2000 4000 0000 7000 Revenue ($000) Ask me anything O Required: Prepare a scattergraph based on the store cost and revenue data. 1. On the graph below, use the point tool to plot the point corresponding to revenues and costs (Store 1) 2. Repeat the same process for the plotter tools (Store 2, Store 3... 3. To enter exact coordinates, double click on the point and enter the exact co-ordinates of x and y. Methods of Estimating Costs Scattergraph Davis Stores Store 2000 4000 0000 7000 Revenue ($000) Ask me anything O
Step by Step Solution
There are 3 Steps involved in it

Get step-by-step solutions from verified subject matter experts