Question: Required Question # 1 (40 marks, How has Pepsi Corporation performed over the 10-year time period from 1981 to 1990? In your critical discussion focus

Required

Question # 1

(40 marks,

How has Pepsi Corporation performed over the 10-year time period from 1981 to 1990?

In your critical discussion focus on qualitative and quantitative indicators. Include the spread between return on equity (ROE) and cost of equity (Ke) in your quantitative discussion.

Question # 2

(30 marks)

Calculate the costs of capital for the individual business segments (soft drinks, restaurants, snack foods)? Be sure to show your assumptions.

Question # 3

(30 marks,

Do business segments cost of capital add up to 11% for the overall corporate cost of capital? Critically discuss Why or why not?

PepsiCo, Inc.: Cost of Capital

This case is distributed without profit to students who have an interest in receiving the included information for research and educational purposes. This constitutes a fair use of any such material as provided for in the Lebanese Law.

"At PepsiCo Inc., cola was king, but it is quietly being dethroned."

It was this lead sentence of a front-page article in the Wall Street Journal that had caught Michael McCartt's eye on June 13, 1991, exactly one week ago. The timing of the article could not have been more appropriate, because McCartt had just received a call from PepsiCo on the morning of June 13 to schedule an interview for a position on the company's treasury staff. As McCartt read the article, he decided that, because of PepsiCo's diversification, he would focus during the interview on the concept of PepsiCo's cost of capital, so he could display the analytical abilities and knowledge of financial concepts he had just honed in business school. He had spent the past week reading PepsiCo's annual reports and gathering information on its competitors in preparation for the interview tomorrow afternoon in New York.

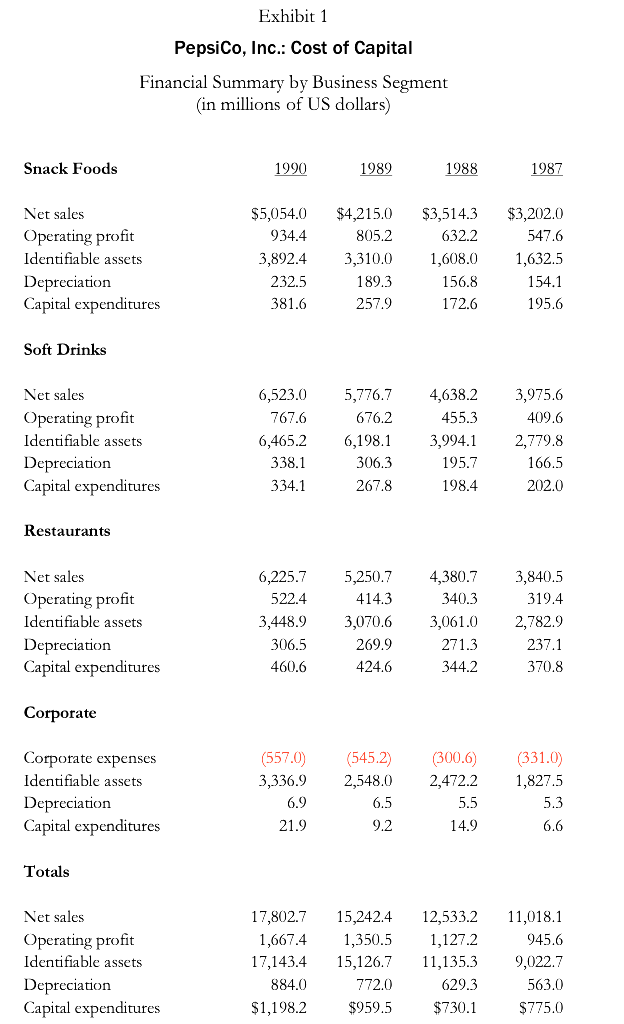
McCartt's research had revealed some interesting facts about PepsiCo. For example, he had been surprised to learn that PepsiCo had invested more than 40% of its capital spending over the last two years in fast-food restaurants, opening them at the rate of three per day, and that during the 1991 fiscal year, the restaurant group was expected to surpass beverages as the company's biggest revenue producer among its three business segments (see Exhibit 1 for a financial summary by business segment). Snack foods, PepsiCo's third line of business, was the biggest profit generator of the three business segments. These findings had raised a central question that McCartt wanted to be prepared to answer for the interview: How should PepsiCo's investment dollars be allocated among the three divisions (i.e., what criteria should be used in a diversified company like PepsiCo to evaluate potential investments)?

PepsiCo History

In its 1990 annual report, PepsiCo described itself as "first and foremost a growth company. Our primary corporate objective is to maximize the value of our shareholders' investments through a strategy of rapid sales growth, close control of costs, and astute investment of our financial resources."

The company was originally incorporated in 1919 under the name of Loft, Inc. The name was changed to the Pepsi-Cola Co. in 1941 after Loft merged with its Pepsi-Cola subsidiary, which it had acquired some three years earlier. The current name, PepsiCo, was adopted in 1965 after Pepsi-Cola merged with Frito-Lay. Under the name of PepsiCo, the company made several significant acquisitions. In November 1977, the Pizza Hut chain was acquired as a PepsiCo subsidiary, as was Taco Bell some seven months later. In July 1986, PepsiCo purchased Seven Up International for $246 million in cash, and three months and $841 million later, Kentucky Fried Chicken (KFC) joined the corporate fold. In 1988 and 1989, the cash outlays continued as two bottling operations, Grand Metropolitan and General Cinema, were bought for $705 million and $1.77 billion, respectively. PepsiCo expanded internationally in 1989 with the purchase of Smiths Crisps Ltd. and Walkers Crisps Holding Ltd., the leading snack- food companies in the United Kingdom, and in 1990 with the acquisition of Mexico's number-one cookie manufacturer, Gamesa.

The resulting conglomerate was a leader in all three of its business segments. As noted by Wayne Calloway, chairman and CEO of PepsiCo, the soft-drink division generated more revenue than General Mills, Inc.; the restaurant group was bigger than Campbell Soup Co.; and the snack-food business approximated Kellogg Co. "PepsiCo doesn't have one flagship, it has three flagships," stated Calloway, "and people would kill to have one of our flagships." Indeed, PepsiCo could boast of having eight different brands?Doritos, Ruffles, KFC Original Recipe, Pizza Hut Pan Pizza, Pepsi, Diet Pepsi, Mountain Dew, and Seven Up?that achieved over $1 billion in retail sales each year. Of its other brands, 25 achieved at least $100 million in annual retail sales.

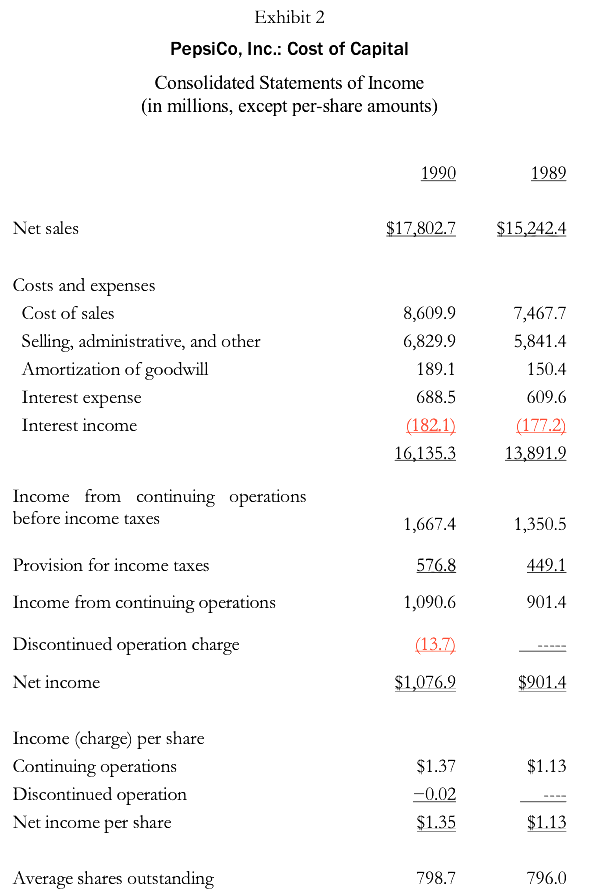
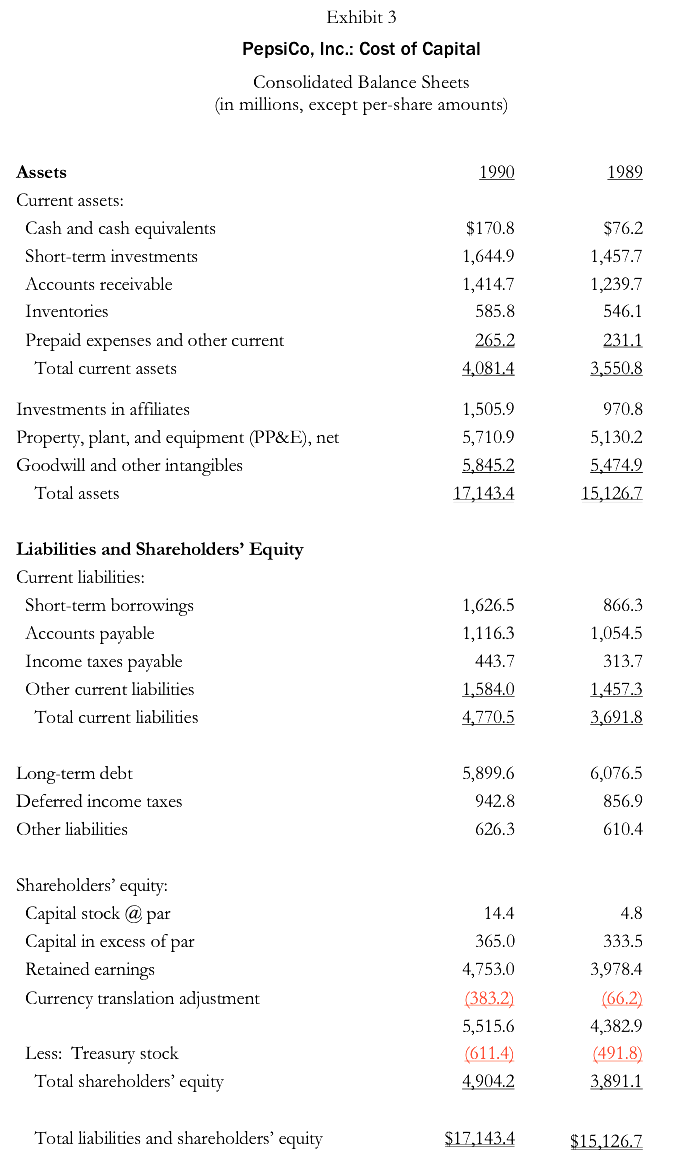
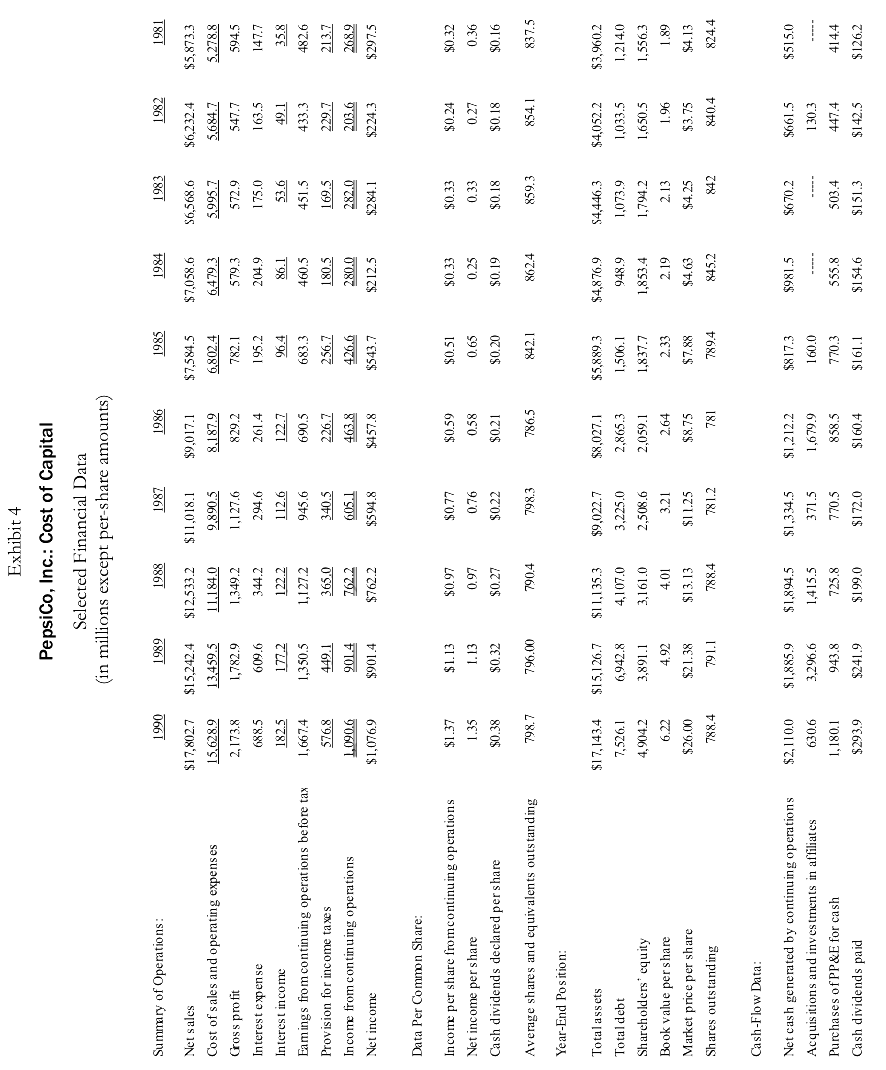
The financial success of PepsiCo is detailed in Exhibits 2, 3, and 4. Between 1985 and 1990, company sales increased at a compound rate of 19%, and income from continuing operations at a compound rate of 21%. In the beverage segment, PepsiCo had Pepsi Cola, the largest-selling food product of any type in US supermarkets and a $13 billion brand worldwide. In the global market, Pepsi Cola was joined on the list of the top 10 selling brands by Diet Pepsi, Caffeine Free Diet Pepsi, and Mountain Dew. With its latest bottling acquisitions, PepsiCo was running the nation's largest network of soft-drink bottling plants. As for the snack-food division, Frito-Lay had the largest share of the US chip market and was more than four times the size of its nearest competitor. With the purchase of Smiths Crisps and Walkers Crisps, PepsiCo Foods International became the leading chip company in Europe. It was in the restaurant segment, however, that the size and scope of PepsiCo's accomplishments may have been the most impressive.

PepsiCo was running the largest restaurant system in the world, with close to 18,500 units, and the three categories of food served by PepsiCo restaurants (pizza, chicken, and Mexican food) were among the fastest- growing segments of the quick-service market. PepsiCo's worldwide sales were greater than $17 billion, and the number of its US restaurants was growing at more than twice the industry average. Pizza Hut not only had a 24% share of the US market as of 1990, but it was also represented in 54 countries internationally and was the leading pizza chain in 46 of those markets. Taco Bell was the leading Mexican-food chain domestically and was just beginning to expand internationally. KFC opened its 3,000th restaurant outside the United States in 1989, making it the largest restaurant chain overseas and the number-one quick-service chicken restaurant in the world.

Financial Strategy

Some industry analysts believed that Pepsi had obtained Frito-Lay in 1965 partly because chips go well with cola, and had obtained the restaurant franchises as a means of getting new fountain outlets. Over the years, however, the company's focus had clearly shifted. The Wall Street Journal article asserted that CEO Calloway was not on any sort of "global beverage quest,"3 but was more interested in building a consumer-products company with the best possible return on equity. PepsiCo's emphasis on performance was clearly stated in the 1990 annual report: "PepsiCo's principal objective is to increase the value of its shareholders' investments through integrated operating, investing and financing strategies that maximize cash returns on investments and optimize the cost of capital."

Although PepsiCo's stock price had increased substantially over the past several years, the aggressive investment strategy had also resulted in an increased amount of debt on the books. Regarding the debt financing, PepsiCo management said:

We support these investments with financial policies that strive to fund our businesses at the lowest possible cost, while giving us the flexibility to pursue growth. Every company faces the question of how much debt is appropriate. PepsiCo's philosophy hasn't changed much over the years, despite leveraged buyouts and the ups and downs of the bond market. We carefully set a corporate leverage target, or a ratio of our net debt4 plus market value of equity. Over time, we strive to achieve a ratio of 20% to 25%. We use market value as a yardstick, rather than the traditional book value, because the market standard reflects the tremendous value of our intangible assets?especially our brands' reputations?while also taking into account our strong potential for growth. Our leveraged target is set with an eye toward maintaining flexibility, which means we can exceed our target occasionally to take advantage of attractive investment opportunities.

The Cost of Capital

According to PepsiCo management, "The cost of capital is a weighting of the cost of debt and equity, with the latter representing a measure of expected returns to investors in PepsiCo's stock. PepsiCo estimates its current cost of capital to be approximately 11%." It was this statement that McCartt had decided to use as the centerpiece of his interview strategy. He had learned in business school that the true cost of capital depended on how the capital was put to use. For instance, the Wall Street Journal article stated that PepsiCo's restaurants were a lot "trickier" to manage than soft drinks. They commanded lower margins and were more fragmented, more capital intensive, and more vulnerable to shifts in consumer spending. McCartt concluded that investments in the restaurant division should be evaluated by using not the corporate weighted-average cost of capital (WACC), but a higher cost of capital.

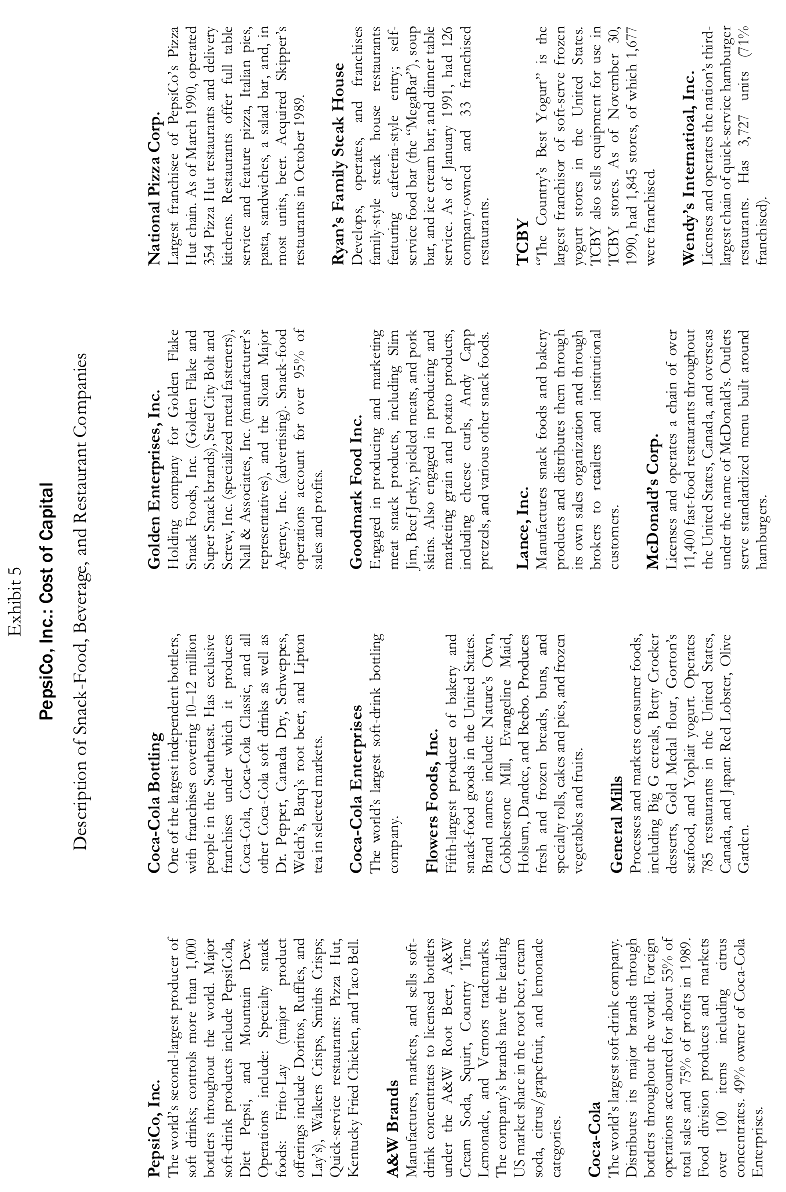
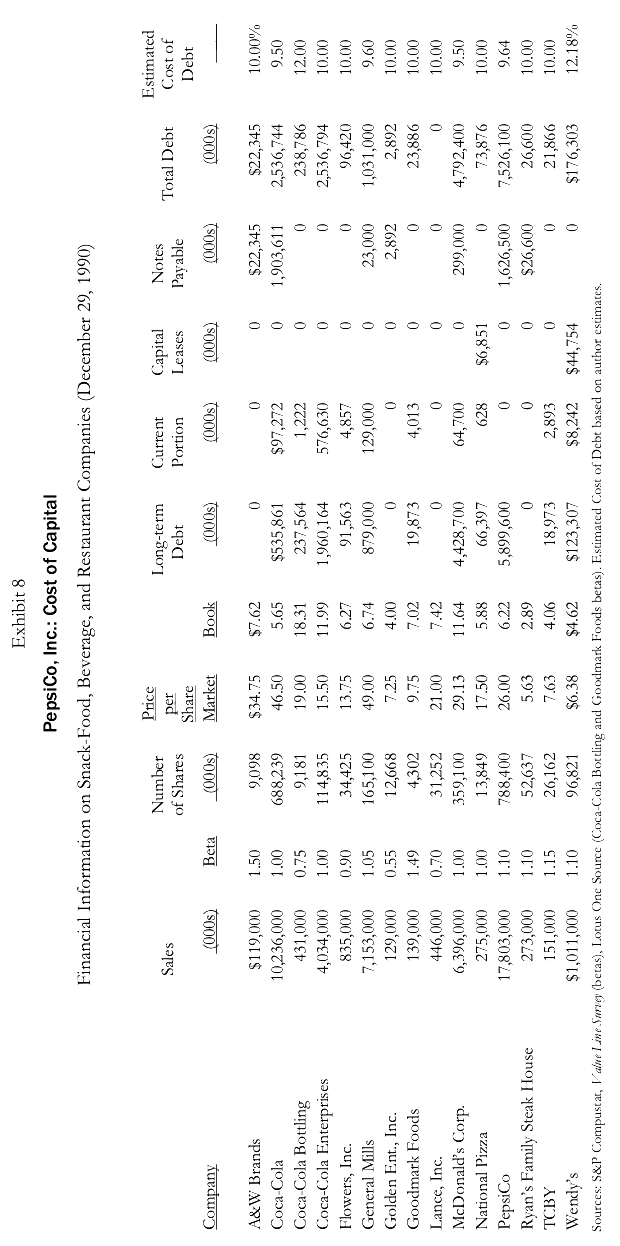
He recalled reading an article by Russell Fuller and Halbert Kerr5 that outlined how to estimate the cost of capital of a division in a multidivision firm. Essentially, each division was matched with a publicly traded company having a single line of business that was as similar as possible to the division's. The cost of capital of such a so-called "pure-play" company served as the best guess of the division's cost of capital. McCartt knew finding perfect pure-plays would be impossible, but he had succeeded in putting together a list of companies with publicly traded stocks that competed in the same business segments as PepsiCo (Exhibit 5).

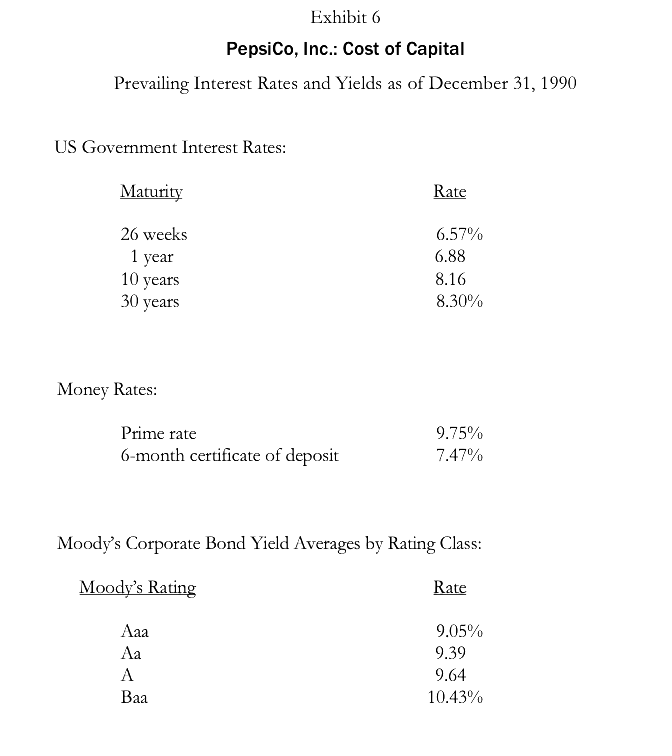
McCartt assumed that PepsiCo was calculating its cost of equity by using the capital-asset pricing model, the formula for which is given in Equation 1:

Ke =Rf+?(Rm -Rf) (1).

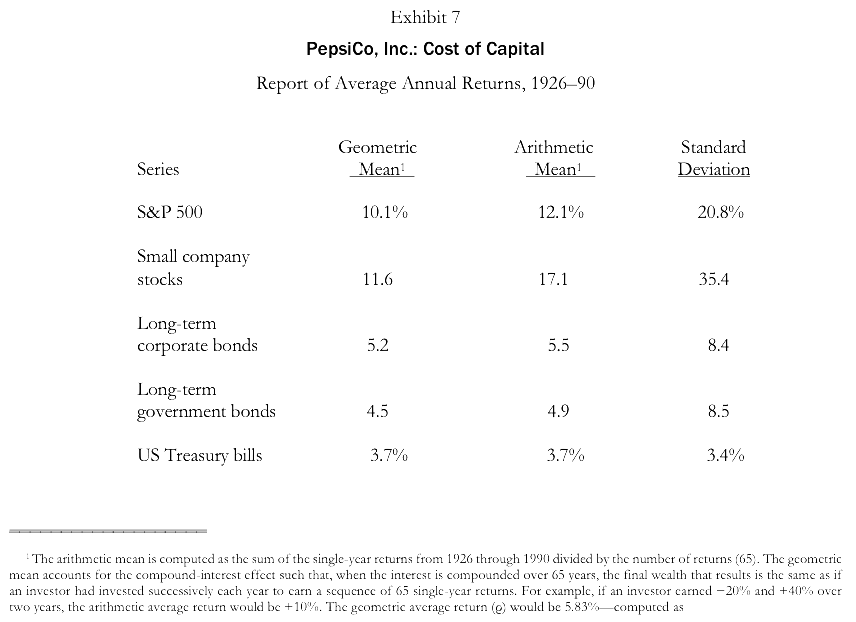
To choose the appropriate risk-free rate, Rf, he looked up the Treasury bond yields in the Wall Street Journal for December 31, 1990, the date of the latest financial information he had for PepsiCo (Exhibit 6). The market risk premium, Rm - Rf, was more difficult to determine, but once he gathered he believed he could decide the appropriate risk premium. The betas, ?, of the pure-play comparable companies are reported in Exhibit 8. Although the pure-plays exhibited a wide range of financial leverage, Fuller and Kerr had reported that unadjusted pure-play betas were better approximations of the division betas than were adjusted betas. McCartt therefore decided not to worry about adjusting betas for financial leverage.

Once he had determined the costs of equity for PepsiCo's three divisions, McCartt intended to calculate their respective hurdle rates using the WACC formula in Equation 2,

WACC=Kd (1??)D/(D+E)+KeE/(D+E) (2),

where Kd is the firm's cost of debt, ? is the corporate tax rate, D is the amount of debt, and E is the amount of equity. His research had revealed that PepsiCo's effective marginal tax rate was 38%, which reflected the combined effects of federal, state, and local taxes, and that its cost of publicly traded debt on December 31, 1990, was 9.6%. After computing each business segment's WACC, McCartt wanted to weight the three costs of capital to see if they summed to 11%, the number given in the annual report. If the individual costs of capital did not prove to be consistent with the corporate cost of capital, McCartt would have difficulty presenting his findings convincingly to his interviewers.

McCartt could not remember reading any other company's annual report that touched on as many financial concepts as PepsiCo's did: shareholder value creation, the cost of capital, market valuation of equity, target- debt ratios, and more. The more he read, the more he could understand why PepsiCo had recently been named one of Fortune magazine's most admired corporations in America, and the more determined he was to make the best of his job interview.

Required Question # 1 (40 marks, How has PepsiRequired Question # 1 (40 marks, How has PepsiRequired Question # 1 (40 marks, How has PepsiRequired Question # 1 (40 marks, How has PepsiRequired Question # 1 (40 marks, How has PepsiRequired Question # 1 (40 marks, How has PepsiRequired Question # 1 (40 marks, How has PepsiRequired Question # 1 (40 marks, How has Pepsi
Exhibit 1 PepsiCo, Inc.: Cost of Capital Financial Summary by Business Segment (in millions of US dollars) Snack Foods 1990 1989 1988 1987 Net sales $5,054.0 $4,215.0 $3,514.3 $3,202.0 Operating profit 934.4 805.2 632.2 547.6 Identifiable assets 3,892.4 3,310.0 1,608.0 1,632.5 Depreciation 232.5 189.3 156.8 154.1 Capital expenditures 381.6 257.9 172.6 195.6 Soft Drinks Net sales 6,523.0 5,776.7 4,638.2 3,975.6 Operating profit 767.6 676.2 455.3 409.6 Identifiable assets 6,465.2 6,198.1 3,994.1 2,779.8 Depreciation 338.1 306.3 195.7 166.5 Capital expenditures 334.1 267.8 198.4 202.0 Restaurants Net sales 6,225.7 5,250.7 4,380.7 3,840.5 Operating profit 522.4 414.3 340.3 319.4 Identifiable assets 3,448.9 3,070.6 3,061.0 2,782.9 Depreciation 306.5 269.9 271.3 237.1 Capital expenditures 460.6 424.6 344.2 370.8 Corporate Corporate expenses (557.0) (545.2) (300.6) (331.0) Identifiable assets 3,336.9 2,548.0 2,472.2 1,827.5 Depreciation 6.9 6.5 5.5 5.3 Capital expenditures 21.9 9.2 14.9 6.6 Totals Net sales 17,802.7 15,242.4 12,533.2 11,018.1 Operating profit 1,667.4 1,350.5 1,127.2 945.6 Identifiable assets 17,143.4 15,126.7 11,135.3 9,022.7 Depreciation 884.0 772.0 629.3 563.0 Capital expenditures $1,198.2 $959.5 $730.1 $775.0Exhibit 2 PepsiCo, lnc.: Cost of Capital Consolidated Statements of Income (in millions, except pershare amounts) 199 Net sales $17 802.? Costs and expenses Cost of sales 8,609.9 Selling, administrative, and other 6,829.9 Amortization of goodwill 189.1 Interest expense 688.5 Interest income 1 182.11 16 1 iii Income from continuing operations before income taxes 1,667.4 Provision for income taxes 576.8 Income from continuing operations 1,090.6 Discontinued operation charge (13.?) Net income 1 0?6.9 Income (charge) per share Continuing operations $1.37 Discontinued operation 0.02 Net income per share 1.35 Average shares outstanding 7'98? 1467.7 5,841 .4 1 50 .4 609.6 13 321.2 Exhibit 3 PepsiCo, |nc.: Cost of Capital Consolidated Balance Sheets (in millions, except per-share amounts) Assets Current assets: Cash and cash equivalents Short-term investments Accounts receivable Inventories Prepaid expenses and other current Total current assets Investments in affiliates Property, plant, and equipment (13138515.), net Goodwill and other intangibles Total assets Liabilities and Shareholders' Equity Current liabilities: Short-term borrowings Accounts payable Income taxes payable Other current liabilities Total current liabilities Long-term debt Deferred income taxes Other liabilities Shareholders' equity: Capital stock @ par Capital in excess of par Retained earnings Currency translation adjustment Less: Treasury stock Total shareholders' equity Total liabilities and shareholders' equity m $170.8 1,644.9 1,414.7 585.8 2012 $984.5 1,505.9 5,710.9 5 845.2 1,626.5 1,116.3 443.7 M 5,899.6 942.8 626.3 14.4 365.0 4,753.0 (333.2) 5,515.6 (611.4) M 866.3 1,054.5 313.7 1 457.3 M 6,076.5 856.9 610.4 4.3 333.5 3,973.4 [66.2) 4,382.9 {491.8} M Exhibit 4 PepsiCo, Inc.: Cost of Capital Selected Financial Data (in millions except per-share amounts) Summary of Operations: 1990 1989 1988 1987 1986 1985 1984 1983 1982 1981 Net sales $17,802.7 $15,242.4 $12,533.2 $11,018.1 $9,017.1 $7,584.5 $7,058.6 $6,568.6 $6,232.4 $5,873.3 Cost of sales and operating expenses 15.628.9 13.459.5 11.184.0 9.890.5 8.187.9 6.802.4 6.479.3 5,995.7 5.684.7 5.278.8 Gross profit 2, 173.8 1,782.9 1,349.2 1,127.6 829. 782.1 579.3 572.9 547.7 594.5 Interest expense 688.5 609.6 344.2 294.6 261.4 195.2 204. 175.0 163.5 147.7 Interest income 182.5 177.2 122.2 112.6 122.7 96.4 86.1 53.6 49.1 35.8 Eamings from continuing operations before tax 1,667.4 1,350.5 1,127.2 945.6 690.5 683.3 460.5 451.5 433.3 482.6 Provision for income taxes 576.8 449. 365.0 340.5 226.7 256.7 180. 169.5 229.7 213.7 In come from continuing operations 1,090.6 901.4 762.2 605.1 463.8 426. 280.0 282.0 203.6 268.9 Net income $1,076.9 $901.4 $762.2 $594.8 $457.8 $543.7 $212. $284.1 $224.3 $297.5 Data Per Common Share: Income per share fromcontinuing operations $1.37 $1. 13 $0.97 $0.77 60.59 $0.51 $0.33 $0.33 $0.24 $0.32 Net income per share 1.35 1.13 0.97 0.76 0.58 0.65 0.25 0.33 0.27 0.36 Cash dividends declared per share $0.38 $0.32 $0.27 $0.22 $0.21 $0.20 $0. 19 $0. 18 $0. 18 $0.16 Average shares and equivalents outstanding 798.7 796.00 790.4 798. 786.5 842.1 862.4 859.3 854.1 837.5 Year-End Position: Total assets $17,143.4 $15,126.7 $1 1,135.3 $9,022.7 $8,027.1 $5,889.3 $4,876.9 $4,446.3 $4,052.2 $3,960.2 Total debt 7,526.1 6,942.8 4,107.0 3,225.0 2,865.3 1,506.1 948.9 1,073.9 1,033.5 1,214.0 Shareholders' equity 4,904.2 3,891.1 3,161.0 2,508.6 2,059. 1,837.7 1,853.4 1,794.2 1,650.5 1,556.3 Book value per share 6.22 4.92 4.01 3.21 2.64 2.3 2.19 2.13 1.96 1.89 Market price per share $26.00 $21.38 $13.13 $1 1.25 $8.75 $7.88 $4.6 $4.25 $3.75 $4.13 Shares outstanding 788.4 791.1 788.4 781.2 781 789.4 845.2 842 840.4 824.4 Cash-Flow Data: Net cash generated by continuing operations $2, 110.0 $1,885.9 $1,894.5 $1,334.5 $1,212.2 $817.3 $981.5 $670.2 $661.5 $515.0 Acquisitions and investments in affiliates 630.6 3,296.6 1,415.5 371.5 1,679.9 160.0 130.3 Purchases of PP&E for cash 1, 180.1 943.8 725.8 770. 858.5 770.3 355. 503.4 447.4 414.4 Cash dividends paid $293.9 $241.9 $199.0 $172.0 $160.4 $161.1 $154.6 $151.3 $142.5 $126.2Exhibit 5 PepsiCo, Inc.: Cost of Capital Description of Snack-Food, Beverage, and Restaurant Companies PepsiCo, Inc. Coca-cola Bottling Golden Enterprises, Inc. National Pizza Corp. The world's second-largest producer of One of the largest independent bottlers, Holding company for Golden Flake Largest franchisee of PepsiCo's Pizza soft drinks; controls more than 1,000 with franchises covering 10-12 million Snack Foods, Inc. (Golden Flake and Hut chain. As of March 1990, operated bottlers throughout the world. Major people in the Southeast. Has exclusive Super Snack brands), Steel City Bolt and 354 Pizza Hut restaurants and delivery soft-drink products include PepsiCola, franchises under which it produces Screw, Inc. (specialized metal fasteners) kitchens. Restaurants offer full table Diet Pepsi, and Mountain Dew. Coca-Cola, Coca-cola Classic, and all Nall & Associates, Inc. (manufacturer's service and feature pizza, Italian pies, Operations include: Specialty snack other Coca-cola soft drinks as well as representatives), and the Sloan Major pasta, sandwiches, a salad bar, and, in foods: Frito-Lay (major product Dr. Pepper, Canada Dry, Schweppes. Agency, Inc. (advertising). Snack-food most units, beer. Acquired Skipper's offerings include Doritos, Ruffles, and Welch's, Barq's root beer, and Lipton operations account for over 95% of restaurants in October 1989. Lay's), Walkers Crisps, Smiths Crisps; tea in selected markets. sales and profits. Quick-service restaurants: Pizza Hut, Ryan's Family Steak House Kentucky Fried Chicken, and Taco Bell. Coca-cola Enterprises Goodmark Food Inc. Develops, operates, and franchises The world's largest soft-drink bottling Engaged in producing and marketing family-style steak house restaurants A&W Brands company. meat snack products, including Slim featuring cafeteria-style entry; self- Manufactures, markets, and sells soft- Jim, Beef Jerky, pickled meats, and pork service food bar (the "MegaBar"), soup drink concentrates to licensed bottlers Flowers Foods, Inc. skins. Also engaged in producing and bar, and ice cream bar; and dinner table under the A&W Root Beer, A& W Fifth-largest producer of bakery and marketing grain and potato products, service. As of January 1991, had 126 Cream Soda, Squirt, Country Time snack-food goods in the United States. induding cheese curls, Andy Capp company-owned and 33 franchised Lemonade, and Vernors trademarks. Brand names include: Nature's Own, pretzels, and various other snack foods. restaurants. The company's brands have the leading Cobblestone Mill, Evangeline Maid, US market share in the root beer, cream Holsum, Dandce, and Becbo. Produces Lance, Inc. TCBY soda, citrus/grapefruit, and lemonade fresh and frozen breads, buns, and Manufactures snack foods and bakery "The Country's Best Yogurt" is the categories. specialty rolls, cakes and pics, and frozen products and distributes them through largest franchisor of soft-serve frozen vegetables and fruits its own sales organization and through yogurt stores in the United States. Coca-Cola brokers to retailers and institutional TCBY also sells equipment for usc in The world's largest soft-drink company General Mills customers. TCBY stores. As of November 30, Distributes its major brands through Processes and markets consumer foods, 1990, had 1,845 stores, of which 1,677 botders throughout the world. Forcign including Big G cereals, Betty Crocker Mcdonald's Corp. were franchised. operations accounted for about 55% of desserts, Gold Medal flour, Gorton's Licenses and operates a chain of over total sales and 75% of profits in 1989. seafood, and Yoplait yogurt. Operates 11,400 fast-food restaurants throughout Wendy's Internationl, Inc. Food division produces and markets 785 restaurants in the United States, the United States, Canada, and overseas Licenses and operates the nation's third- over 100 items including citrus Canada, and Japan: Red Lobster, Olive under the name of Mcdonald's. Outlets largest chain of quick-service hamburger concentrates. 49% owner of Coca-Cola Garden. scrvc standardized menu built around restaurants. Has 3,727 units (71% Enterprises. hamburgers. franchised).Exhibit 6 PepsiCo, Inc.: Cost of Capital Prevailing Interest Rates and Yields as of December 31, 1990 US Government Interest Rates: Maturity Rate 26 weeks 6.57% 1 year 6.88 10 years 8.16 30 years 8.30% Money Rates: Prime rate 9.75% 6-month certificate of deposit 7.47% Moody's Corporate Bond Yield Averages by Rating Class: Moody's Rating Rate Aaa 9.05% Aa 9.39 A 9.64 Baa 10.43%Exhibit 7' PepsiCo, |nc.: Cost of Capital Report of Average Annual Returns, 192690 Geometric Arithmetic Stand arr] Series Meani Mean] Deviation 35:1) 500 10.1% 12.1% 20.8% Small company stocks 11.6 17.1 35.4 Long term corporate bonds 5.2 5.5 8.4 Long term government bonds 4.5 4.9 8.5 US Treasury bills 3.7% 33% 3.4% \"The arithmetic mean is computed as the sum oi'the single-year returns from 1920 through 1990 divided by the number o f returns [(15). The geometric mean accounts for the compound-interest effect such that, when the interest is com pounded over {:5 years, the final wealth that results is the same as if an investor had invested successively each year to earn a sequence oi'GS single year returns. For example, if an investor earned -20ilr'n and +-1-0";'-.1 over two years, the arithmetic average return would be +10%. The geometric average return (9) would he 5.830-1neo m puted as Exhibit 8 PepsiCo, Inc.: Cost of Capital Financial Information on Snack-Food, Beverage, and Restaurant Companies (December 29, 1990) Number Price Current Capital Notes Estimated Long-term Sales per Debt Payable Total Debt Cost of of Shares Portion Leases Share Debt Company 000s) Beta (000s) Market Book (00 0s) (000s) (000s) (000s) (000s) A&W Brands $119,000 1.50 9,098 $34.75 $7.62 $22,345 $22,345 10.00% Coca-Cola 10,236,000 1.00 688,239 46.50 5.65 $535,861 $97,272 1,903,611 2,536,744 9.50 Coca-cola Bottling 431,000 0.75 9,181 19.00 18.31 237,564 1,222 238,786 12.00 Coca-cola Enterprises 4,034,000 1.00 114,835 15.50 11.99 1,960,164 576,630 2,536,794 10.00 Flowers, Inc. 835,000 0.90 34,425 13.75 6.27 91,563 4,857 96,420 10.00 General Mills 7,153,000 1.05 165,100 49.00 6.74 879,000 129,000 23,000 1,031,000 9.60 Golden Ent., Inc. 129,000 0.55 12,668 7.25 4.00 2,892 2,892 10.00 Goodmark Foods 139,000 1.49 4,302 9.75 7.02 19,873 4,013 23,886 10.00 OC Lance, Inc. 446,000 0.70 31,252 21.00 7.42 10.00 Mcdonald's Corp. 6,396,000 1.00 359,100 29.13 11.64 4,428,700 64,700 299,000 4,792,400 9.50 National Pizza 275,000 1.00 13,849 17.50 5.88 66,397 628 $6,851 73,876 10.00 PepsiCo 17,803,000 1.10 788,400 26.00 6.22 5,899,600 1,626,500 7,526,100 9.64 Ryan's Family Steak House 273,000 1.10 52,637 5.63 2.89 0 0 0 $26,600 26,600 10.00 TCBY 151,000 1.15 26,162 7.63 4.06 18,973 2,893 21,866 10.00 Wendy's $1,011,000 1.10 96,821 $6.38 $4.62 $123,307 $8,242 $44,754 $176,303 12.18% Sources: S&P Compustat, Valve Line Survey (betas), Lotus One Source (Coca-Cola Bottling and Goodmark Foods betas). Estimated Cost of Debt based on author estimates

Step by Step Solution

There are 3 Steps involved in it

1 Expert Approved Answer
Step: 1 Unlock blur-text-image
Question Has Been Solved by an Expert!

Get step-by-step solutions from verified subject matter experts

Step: 2 Unlock
Step: 3 Unlock

Students Have Also Explored These Related Finance Questions!