

Question: . Required Question: Do Horizontal analysis and Vertical analysis to examine critically the performance of the organization for the F.Y.- 2018-19 & 2019-20 using the
.
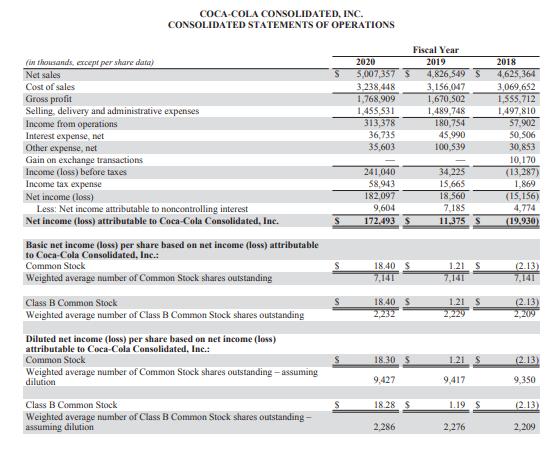
Required Question: Do Horizontal analysis and Vertical analysis to examine critically the performance of the organization for the F.Y.- 2018-19 & 2019-20 using the published financial statements..
COCA-COLA CONSOLIDATED, INC. CONSOLIDATED STATEMENTS OF OPERATIONS (in thousands, except per share data) Net sales Cost of sales Gross profit Selling, delivery and administrative expenses Income from operations Interest expense, net Other expense, net Gain on exchange transactions Income (loss) before taxes Income tax expense Net income (loss) Less: Net income attributable to noncontrolling interest Net income (loss) attributable to Coca-Cola Consolidated, Inc. Basic net income (loss) per share based on net income (loss) attributable to Coca-Cola Consolidated, Inc.: Common Stock Weighted average number of Common Stock shares outstanding Class B Common Stock Weighted average number of Class B Common Stock shares outstanding Diluted net income (loss) per share based on net income (loss) attributable to Coca-Cola Consolidated, Inc.: Common Stock Weighted average number of Common Stock shares outstanding - assuming dilution Class B Common Stock Weighted average number of Class B Common Stock shares outstanding- assuming dilution S 2020 5,007,357 S 3,238,448 1,768,909 1,455,531 313,378 36,735 35.603 241,040 58,943 182,097 9,604 172,493 18.40 7,141 18.40 S 2,232 18.30 S 9,427 18.28 $ 2,286 Fiscal Year 2019 4,826,549 S 3,156,047 1,670,502 1,489,748 180,754 45,990 100,539 34,225 15,665 18,560 7,185 11.375 S 1.21 1.21 S 2.229 1.21 S 9,417 1.19 S 2,276 2018 4,625,364 3,069,652 1,555,712 1,497,810 57,902 50,506 30,853 10,170 (13,287) 1,869 (15,156) 4,774 (19,930) (2.13) 7,141 (2.13) 2,209 (2.13) 9,350 (2.13) 2,209 COCA-COLA CONSOLIDATED, INC. CONSOLIDATED STATEMENTS OF OPERATIONS (in thousands, except per share data) Net sales Cost of sales Gross profit Selling, delivery and administrative expenses Income from operations Interest expense, net Other expense, net Gain on exchange transactions Income (loss) before taxes Income tax expense Net income (loss) Less: Net income attributable to noncontrolling interest Net income (loss) attributable to Coca-Cola Consolidated, Inc. Basic net income (loss) per share based on net income (loss) attributable to Coca-Cola Consolidated, Inc.: Common Stock Weighted average number of Common Stock shares outstanding Class B Common Stock Weighted average number of Class B Common Stock shares outstanding Diluted net income (loss) per share based on net income (loss) attributable to Coca-Cola Consolidated, Inc.: Common Stock Weighted average number of Common Stock shares outstanding - assuming dilution Class B Common Stock Weighted average number of Class B Common Stock shares outstanding- assuming dilution S 2020 5,007,357 S 3,238,448 1,768,909 1,455,531 313,378 36,735 35.603 241,040 58,943 182,097 9,604 172,493 18.40 7,141 18.40 S 2,232 18.30 S 9,427 18.28 $ 2,286 Fiscal Year 2019 4,826,549 S 3,156,047 1,670,502 1,489,748 180,754 45,990 100,539 34,225 15,665 18,560 7,185 11.375 S 1.21 1.21 S 2.229 1.21 S 9,417 1.19 S 2,276 2018 4,625,364 3,069,652 1,555,712 1,497,810 57,902 50,506 30,853 10,170 (13,287) 1,869 (15,156) 4,774 (19,930) (2.13) 7,141 (2.13) 2,209 (2.13) 9,350 (2.13) 2,209 COCA-COLA CONSOLIDATED, INC. CONSOLIDATED STATEMENTS OF OPERATIONS (in thousands, except per share data) Net sales Cost of sales Gross profit Selling, delivery and administrative expenses Income from operations Interest expense, net Other expense, net Gain on exchange transactions Income (loss) before taxes Income tax expense Net income (loss) Less: Net income attributable to noncontrolling interest Net income (loss) attributable to Coca-Cola Consolidated, Inc. Basic net income (loss) per share based on net income (loss) attributable to Coca-Cola Consolidated, Inc.: Common Stock Weighted average number of Common Stock shares outstanding Class B Common Stock Weighted average number of Class B Common Stock shares outstanding Diluted net income (loss) per share based on net income (loss) attributable to Coca-Cola Consolidated, Inc.: Common Stock Weighted average number of Common Stock shares outstanding - assuming dilution Class B Common Stock Weighted average number of Class B Common Stock shares outstanding- assuming dilution S 2020 5,007,357 S 3,238,448 1,768,909 1,455,531 313,378 36,735 35.603 241,040 58,943 182,097 9,604 172,493 18.40 7,141 18.40 S 2,232 18.30 S 9,427 18.28 $ 2,286 Fiscal Year 2019 4,826,549 S 3,156,047 1,670,502 1,489,748 180,754 45,990 100,539 34,225 15,665 18,560 7,185 11.375 S 1.21 1.21 S 2.229 1.21 S 9,417 1.19 S 2,276 2018 4,625,364 3,069,652 1,555,712 1,497,810 57,902 50,506 30,853 10,170 (13,287) 1,869 (15,156) 4,774 (19,930) (2.13) 7,141 (2.13) 2,209 (2.13) 9,350 (2.13) 2,209 COCA-COLA CONSOLIDATED, INC. CONSOLIDATED STATEMENTS OF OPERATIONS (in thousands, except per share data) Net sales Cost of sales Gross profit Selling, delivery and administrative expenses Income from operations Interest expense, net Other expense, net Gain on exchange transactions Income (loss) before taxes Income tax expense Net income (loss) Less: Net income attributable to noncontrolling interest Net income (loss) attributable to Coca-Cola Consolidated, Inc. Basic net income (loss) per share based on net income (loss) attributable to Coca-Cola Consolidated, Inc.: Common Stock Weighted average number of Common Stock shares outstanding Class B Common Stock Weighted average number of Class B Common Stock shares outstanding Diluted net income (loss) per share based on net income (loss) attributable to Coca-Cola Consolidated, Inc.: Common Stock Weighted average number of Common Stock shares outstanding - assuming dilution Class B Common Stock Weighted average number of Class B Common Stock shares outstanding- assuming dilution S 2020 5,007,357 S 3,238,448 1,768,909 1,455,531 313,378 36,735 35.603 241,040 58,943 182,097 9,604 172,493 18.40 7,141 18.40 S 2,232 18.30 S 9,427 18.28 $ 2,286 Fiscal Year 2019 4,826,549 S 3,156,047 1,670,502 1,489,748 180,754 45,990 100,539 34,225 15,665 18,560 7,185 11.375 S 1.21 1.21 S 2.229 1.21 S 9,417 1.19 S 2,276 2018 4,625,364 3,069,652 1,555,712 1,497,810 57,902 50,506 30,853 10,170 (13,287) 1,869 (15,156) 4,774 (19,930) (2.13) 7,141 (2.13) 2,209 (2.13) 9,350 (2.13) 2,209 COCA-COLA CONSOLIDATED, INC. CONSOLIDATED STATEMENTS OF OPERATIONS (in thousands, except per share data) Net sales Cost of sales Gross profit Selling, delivery and administrative expenses Income from operations Interest expense, net Other expense, net Gain on exchange transactions Income (loss) before taxes Income tax expense Net income (loss) Less: Net income attributable to noncontrolling interest Net income (loss) attributable to Coca-Cola Consolidated, Inc. Basic net income (loss) per share based on net income (loss) attributable to Coca-Cola Consolidated, Inc.: Common Stock Weighted average number of Common Stock shares outstanding Class B Common Stock Weighted average number of Class B Common Stock shares outstanding Diluted net income (loss) per share based on net income (loss) attributable to Coca-Cola Consolidated, Inc.: Common Stock Weighted average number of Common Stock shares outstanding - assuming dilution Class B Common Stock Weighted average number of Class B Common Stock shares outstanding- assuming dilution S 2020 5,007,357 S 3,238,448 1,768,909 1,455,531 313,378 36,735 35.603 241,040 58,943 182,097 9,604 172,493 18.40 7,141 18.40 S 2,232 18.30 S 9,427 18.28 $ 2,286 Fiscal Year 2019 4,826,549 S 3,156,047 1,670,502 1,489,748 180,754 45,990 100,539 34,225 15,665 18,560 7,185 11.375 S 1.21 1.21 S 2.229 1.21 S 9,417 1.19 S 2,276 2018 4,625,364 3,069,652 1,555,712 1,497,810 57,902 50,506 30,853 10,170 (13,287) 1,869 (15,156) 4,774 (19,930) (2.13) 7,141 (2.13) 2,209 (2.13) 9,350 (2.13) 2,209 COCA-COLA CONSOLIDATED, INC. CONSOLIDATED STATEMENTS OF OPERATIONS (in thousands, except per share data) Net sales Cost of sales Gross profit Selling, delivery and administrative expenses Income from operations Interest expense, net Other expense, net Gain on exchange transactions Income (loss) before taxes Income tax expense Net income (loss) Less: Net income attributable to noncontrolling interest Net income (loss) attributable to Coca-Cola Consolidated, Inc. Basic net income (loss) per share based on net income (loss) attributable to Coca-Cola Consolidated, Inc.: Common Stock Weighted average number of Common Stock shares outstanding Class B Common Stock Weighted average number of Class B Common Stock shares outstanding Diluted net income (loss) per share based on net income (loss) attributable to Coca-Cola Consolidated, Inc.: Common Stock Weighted average number of Common Stock shares outstanding - assuming dilution Class B Common Stock Weighted average number of Class B Common Stock shares outstanding- assuming dilution S 2020 5,007,357 S 3,238,448 1,768,909 1,455,531 313,378 36,735 35.603 241,040 58,943 182,097 9,604 172,493 18.40 7,141 18.40 S 2,232 18.30 S 9,427 18.28 $ 2,286 Fiscal Year 2019 4,826,549 S 3,156,047 1,670,502 1,489,748 180,754 45,990 100,539 34,225 15,665 18,560 7,185 11.375 S 1.21 1.21 S 2.229 1.21 S 9,417 1.19 S 2,276 2018 4,625,364 3,069,652 1,555,712 1,497,810 57,902 50,506 30,853 10,170 (13,287) 1,869 (15,156) 4,774 (19,930) (2.13) 7,141 (2.13) 2,209 (2.13) 9,350 (2.13) 2,209 COCA-COLA CONSOLIDATED, INC. CONSOLIDATED STATEMENTS OF OPERATIONS (in thousands, except per share data) Net sales Cost of sales Gross profit Selling, delivery and administrative expenses Income from operations Interest expense, net Other expense, net Gain on exchange transactions Income (loss) before taxes Income tax expense Net income (loss) Less: Net income attributable to noncontrolling interest Net income (loss) attributable to Coca-Cola Consolidated, Inc. Basic net income (loss) per share based on net income (loss) attributable to Coca-Cola Consolidated, Inc.: Common Stock Weighted average number of Common Stock shares outstanding Class B Common Stock Weighted average number of Class B Common Stock shares outstanding Diluted net income (loss) per share based on net income (loss) attributable to Coca-Cola Consolidated, Inc.: Common Stock Weighted average number of Common Stock shares outstanding - assuming dilution Class B Common Stock Weighted average number of Class B Common Stock shares outstanding- assuming dilution S 2020 5,007,357 S 3,238,448 1,768,909 1,455,531 313,378 36,735 35.603 241,040 58,943 182,097 9,604 172,493 18.40 7,141 18.40 S 2,232 18.30 S 9,427 18.28 $ 2,286 Fiscal Year 2019 4,826,549 S 3,156,047 1,670,502 1,489,748 180,754 45,990 100,539 34,225 15,665 18,560 7,185 11.375 S 1.21 1.21 S 2.229 1.21 S 9,417 1.19 S 2,276 2018 4,625,364 3,069,652 1,555,712 1,497,810 57,902 50,506 30,853 10,170 (13,287) 1,869 (15,156) 4,774 (19,930) (2.13) 7,141 (2.13) 2,209 (2.13) 9,350 (2.13) 2,209 COCA-COLA CONSOLIDATED, INC. CONSOLIDATED STATEMENTS OF OPERATIONS (in thousands, except per share data) Net sales Cost of sales Gross profit Selling, delivery and administrative expenses Income from operations Interest expense, net Other expense, net Gain on exchange transactions Income (loss) before taxes Income tax expense Net income (loss) Less: Net income attributable to noncontrolling interest Net income (loss) attributable to Coca-Cola Consolidated, Inc. Basic net income (loss) per share based on net income (loss) attributable to Coca-Cola Consolidated, Inc.: Common Stock Weighted average number of Common Stock shares outstanding Class B Common Stock Weighted average number of Class B Common Stock shares outstanding Diluted net income (loss) per share based on net income (loss) attributable to Coca-Cola Consolidated, Inc.: Common Stock Weighted average number of Common Stock shares outstanding - assuming dilution Class B Common Stock Weighted average number of Class B Common Stock shares outstanding- assuming dilution S 2020 5,007,357 S 3,238,448 1,768,909 1,455,531 313,378 36,735 35.603 241,040 58,943 182,097 9,604 172,493 18.40 7,141 18.40 S 2,232 18.30 S 9,427 18.28 $ 2,286 Fiscal Year 2019 4,826,549 S 3,156,047 1,670,502 1,489,748 180,754 45,990 100,539 34,225 15,665 18,560 7,185 11.375 S 1.21 1.21 S 2.229 1.21 S 9,417 1.19 S 2,276 2018 4,625,364 3,069,652 1,555,712 1,497,810 57,902 50,506 30,853 10,170 (13,287) 1,869 (15,156) 4,774 (19,930) (2.13) 7,141 (2.13) 2,209 (2.13) 9,350 (2.13) 2,209
Step by Step Solution
3.44 Rating (151 Votes )
There are 3 Steps involved in it

Get step-by-step solutions from verified subject matter experts