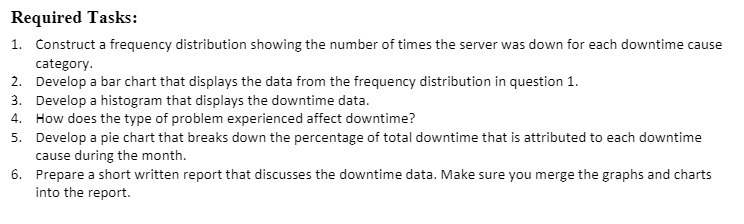
Question: Required Tasks: 1. Construct a frequency distribution showing the number of times the server was down for each downtime cause category. 2. Develop a bar

Required Tasks: 1. Construct a frequency
Required Tasks: 1. Construct a frequency distribution showing the number of times the server was down for each downtime cause category. 2. Develop a bar chart that displays the data from the frequency distribution in question 1. 3. Develop a histogram that displays the downtime data. 4. How does the type of problem experienced affect downtime? 5. Develop a pie chart that breaks down the percentage of total downtime that is attributed to each downtime cause during the month. 6. Prepare a short written report that discusses the downtime data. Make sure you merge the graphs and charts into the report

Step by Step Solution

There are 3 Steps involved in it

1 Expert Approved Answer
Step: 1 Unlock blur-text-image
Question Has Been Solved by an Expert!

Get step-by-step solutions from verified subject matter experts

Step: 2 Unlock
Step: 3 Unlock

Students Have Also Explored These Related Mathematics Questions!