

Question: Required: Using highlight tables, ( 1 ) consider the amount of the total relationship between the vendor and the company is serviced by the A
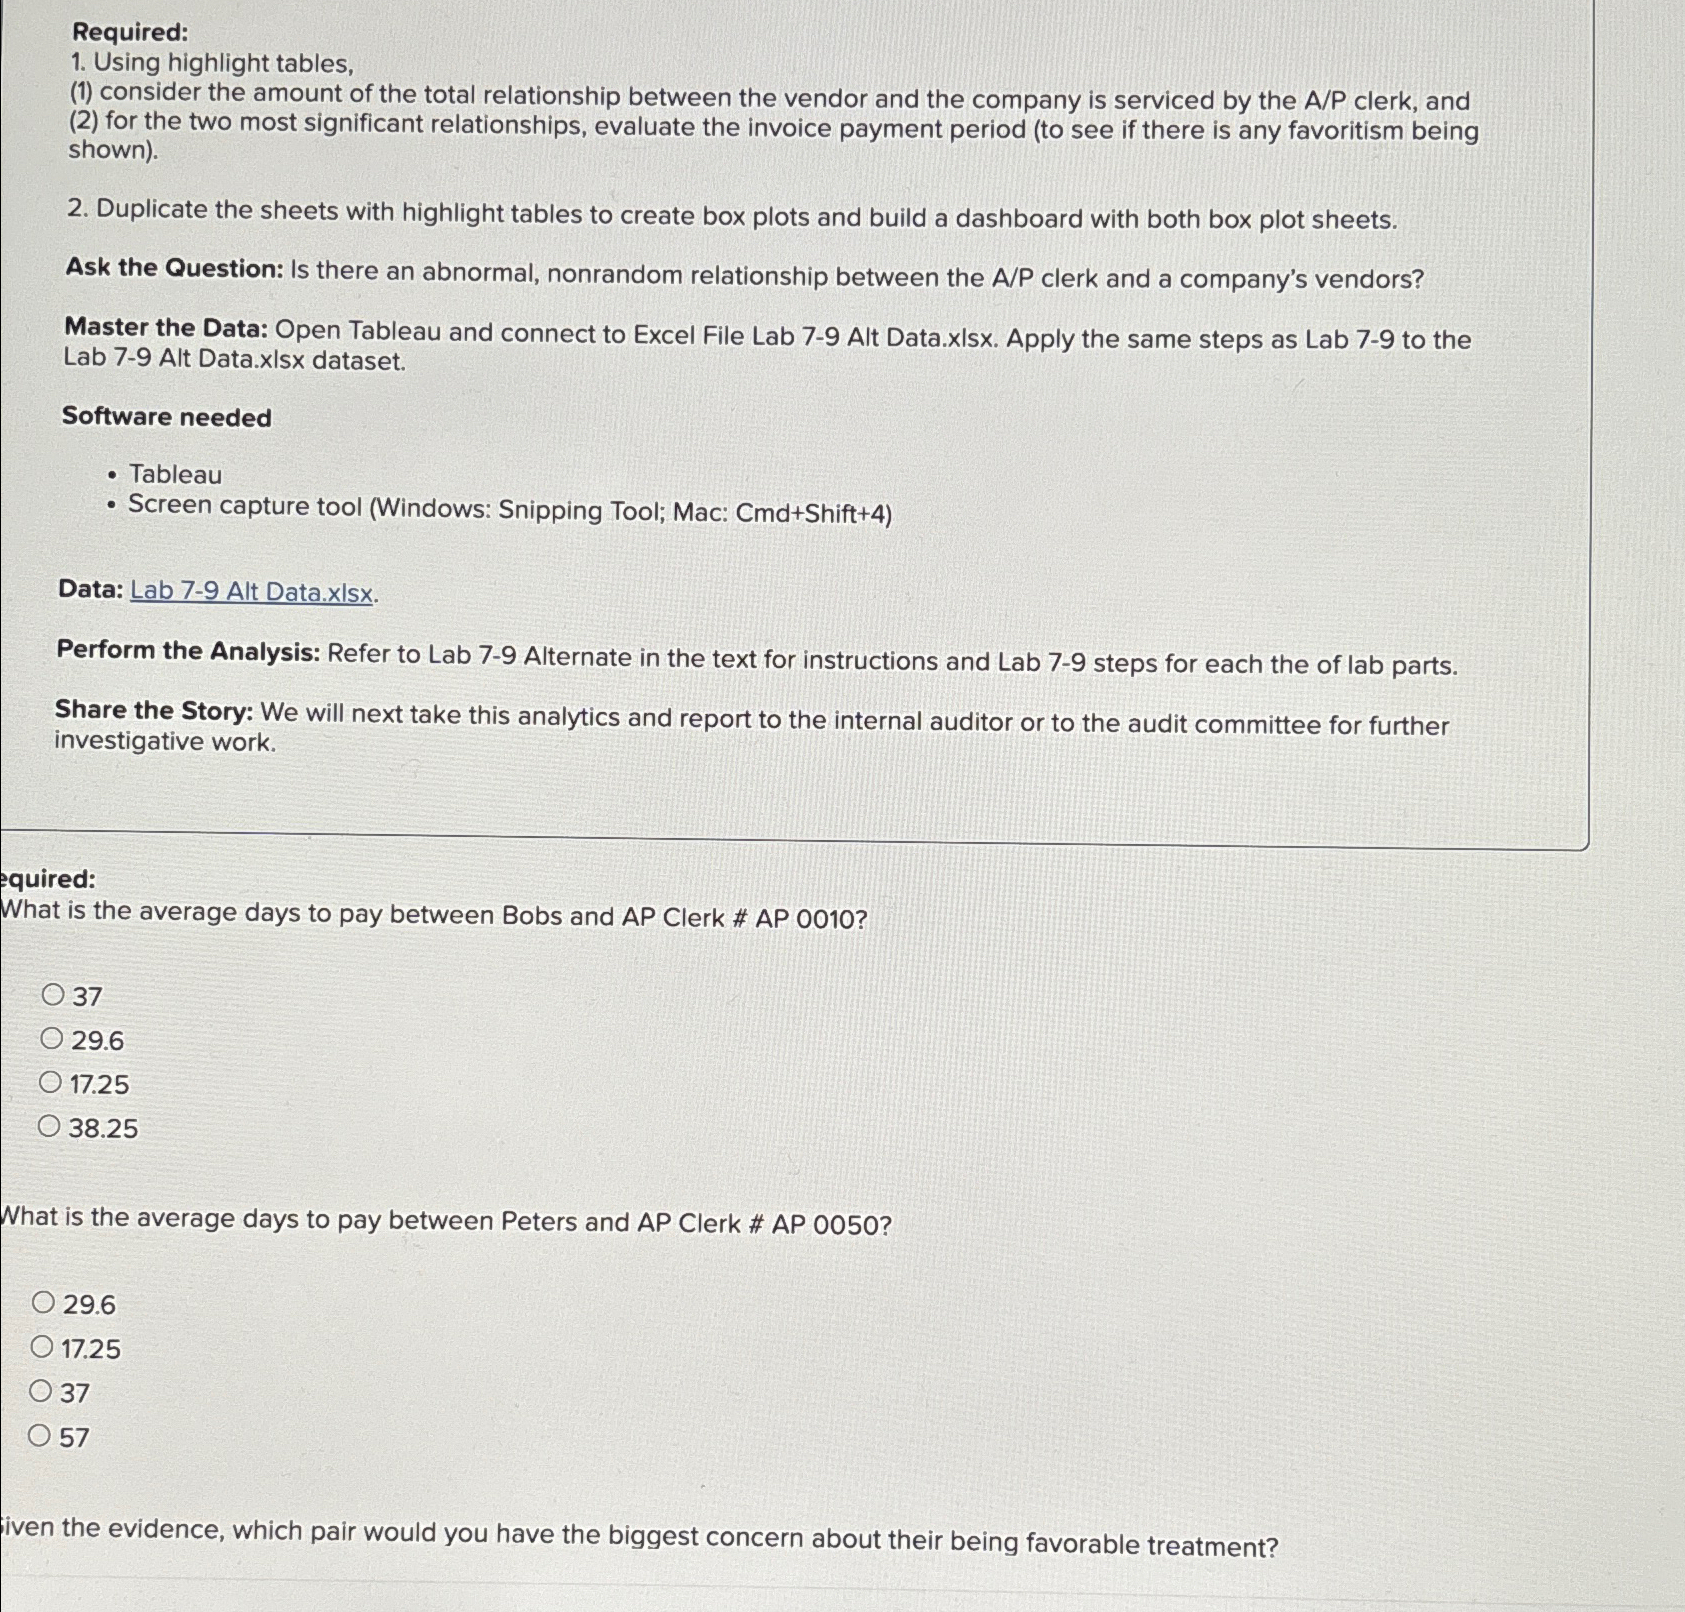
Required:
Using highlight tables,
consider the amount of the total relationship between the vendor and the company is serviced by the AP clerk, and for the two most significant relationships, evaluate the invoice payment period to see if there is any favoritism being shown
Duplicate the sheets with highlight tables to create box plots and build a dashboard with both box plot sheets.
Ask the Question: Is there an abnormal, nonrandom relationship between the AP clerk and a company's vendors?
Master the Data: Open Tableau and connect to Excel File Lab Alt Data.xIsx. Apply the same steps as Lab to the Lab Alt Data.xlsx dataset.
Software needed
Tableau
Screen capture tool Windows: Snipping Tool; Mac: CmdShift
Data: Lab Alt Data.xIsx.
Perform the Analysis: Refer to Lab Alternate in the text for instructions and Lab steps for each the of lab parts.
Share the Story: We will next take this analytics and report to the internal auditor or to the audit committee for further investigative work.
quired:
What is the average days to pay between Bobs and AP Clerk # AP
What is the average days to pay between Peters and AP Clerk # AP
iven the evidence, which pair would you have the biggest concern about their being favorable treatment?
Step by Step Solution
There are 3 Steps involved in it
1 Expert Approved Answer
Step: 1 Unlock

Question Has Been Solved by an Expert!
Get step-by-step solutions from verified subject matter experts
Step: 2 Unlock
Step: 3 Unlock