

Question: Requirement #1: Ch 2: Cash Flow Identify: Using the annual balance sheet and the Income Statement calculate the cash flow identify a) OCF b) NCS
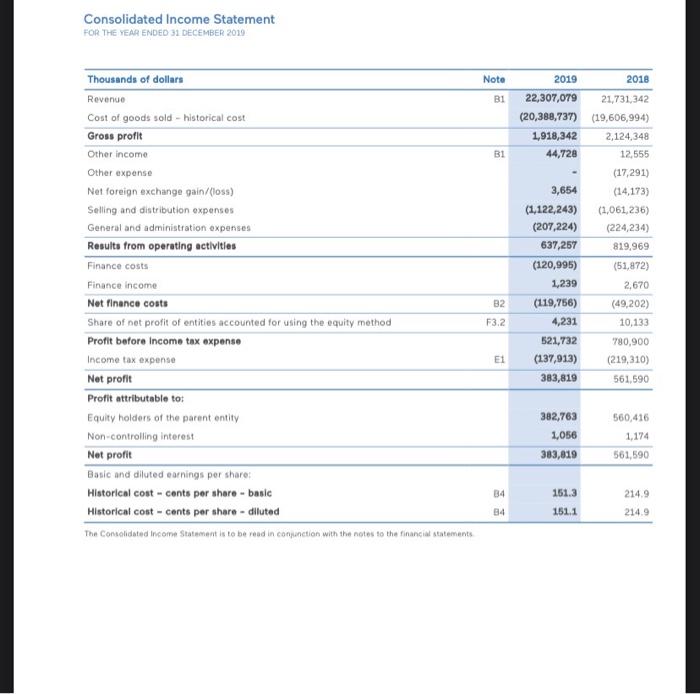
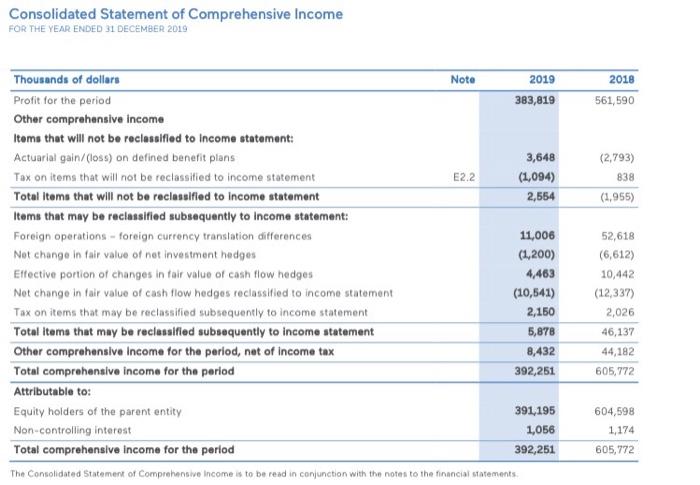
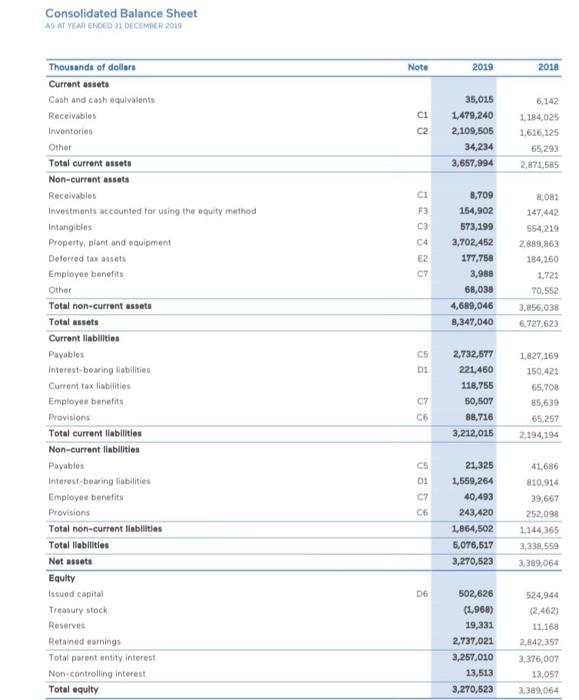
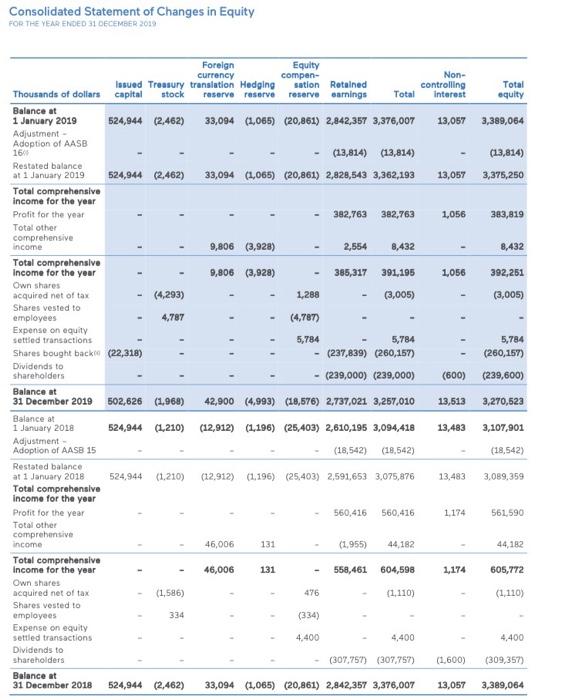
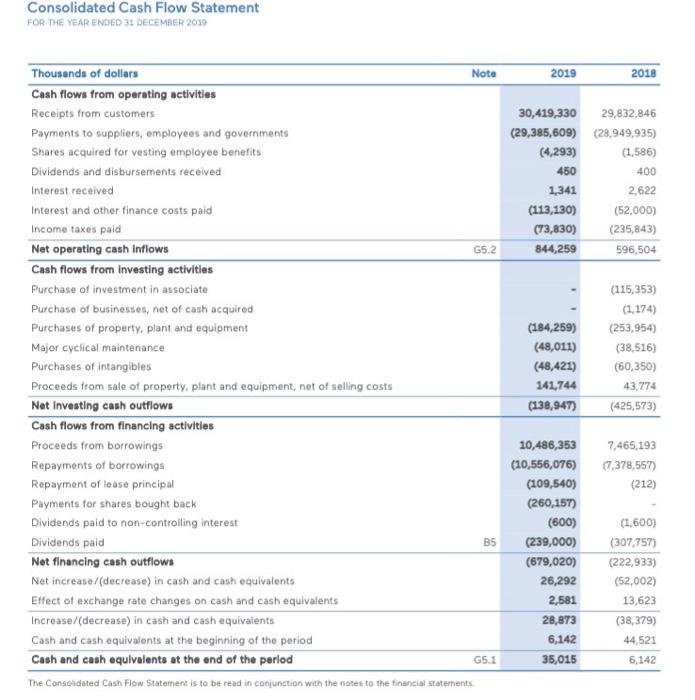
Requirement #1: Ch 2: Cash Flow Identify: Using the annual balance sheet and the Income Statement calculate the cash flow identify a) OCF b) NCS c) changes in NWC d) Is the Net working capital negative or positive? e) Does this indicate any potential difficulty for the company? f) CFA g) CFC h) is the Cash Flow to Creditors Negative? i) Explain how this might come about? j) What is the last total dividend pay? -refer to the Statement of Changes in Equity k) Did the company issue new shares? Yes or no. What is the total dollar value?-refer to the Statement of Changes in Equity 1) Did the company repurchase shares? Yes or no. What is the total dollar value? - refer to the Statement of Changes in Equity m) Based on the information above (from point "a" to "T"), what is your opinion in regards to the cash flow of your company? Requirement # 2: Ch 3: Ratio Analysis Using the financial statements of your assigned company, calculate each of following ratios listed below for the last two years. Calculate: a) Current ratio b) Quick Ratio c) Total Assets Turnover d) Total Debt Ratio = TD/TA e) Debt-Equity Ratio f) Long-Term Debt Ratio = LTD/LTD + TE) g) Times Interest earned = EBIT/Interest h) Cash-coverage ratio = (EBIT + Dep) / Interest 3 Consolidated Income Statement FOR THE YEAR ENDED 31 DECEMBER 2010 Note BI BI Thousands of dollars Revenue Cost of goods sold - historical cost Gross profit Other income Other expense Net foreign exchange gain/(loss) Selling and distribution expenses General and administration expenses Results from operating activities Finance costs 2019 2018 22,307,079 21,731,342 (20,388,737) (19,606,994) 1,918,342 2,124,348 44,728 12,555 (17,291) 3,654 (14,173) (1,122,243) (1,061,236) (207,224) (224,234) 637,257 819,969 (120,995) (51,872) 1,239 2,670 (119,756) (49,202) 4,231 10,133 521,732 780,900 (1.37,913) (219,310) 383,819 561,690 Finance income 82 F3.2 E1 Net finance costs Share of net profit of entities accounted for using the equity method Profit before Income tax expense Income tax expense Net profit Profit attributable to: Equity holders of the parent entity Non-controlling interest Net profit Basic and diluted earnings per shares Historical cost-cents per shore-basic Historical cost-cents per share-diluted The Consolidated Income Statement is to be read in conjunction with the notes to the financial statements 382,763 1,056 383,819 560,416 1,174 561,590 B4 151.3 151.1 214.9 214.9 34 Consolidated Statement of Comprehensive Income FOR THE YEAR ENDED 31 DECEMBER 2019 Note 2019 383,819 2018 561,590 E2.2 3,648 (1,094) 2,554 (2,793) 838 (1,955) Thousands of dollars Profit for the period Other comprehensive income Items that will not be reclassified to income statement: Actuarial gain/(loss) on defined benefit plans Tax on items that will not be reclassified to income statement Total Items that will not be reclassified to income statement Items that may be reclassified subsequently to Income statement: Foreign operations - foreign currency translation differences Not change in fair value of not investment hedges Effective portion of changes in fair value of cash flow hedges Net change in fair value of cash flow hedges reclassified to income statement Tax on items that may be reclassified subsequently to income statement Total items that may be reclassified subsequently to income statement Other comprehensive Income for the period, net of income tax Total comprehensive income for the period Attributable to: Equity holders of the parent entity Non-controlling interest Total comprehensive income for the period 11,006 (1,200) 4,463 (10,541) 2,150 5,878 8,432 392,251 52,618 (6,612) 10,442 (12,337) 2,026 46,137 44,182 605,772 391,195 1,056 392,251 604,598 1,174 605,772 The Consolidated Statement of Comprehensive Income is to be read in conjunction with the notes to the financial statements Consolidated Balance Sheet AS AT YEAR ENDED 1 DECEMBER 2012 Note 2019 2010 CI C2 35,015 1,479,240 2,109,505 34,234 3,657,994 6,142 1,184,025 1616,125 65.293 2,871585 F3 C3 8,709 154,902 573,199 2,702,452 177,758 3,988 68,038 4,689,046 1,347,040 8,081 147.442 554,219 2.889,863 184,260 1.721 C4 E2 C7 70,552 3,856,038 6,727,623 C5 DI Thousands of dollars Current assets Cash and cash equivalents Receivables Inventories Other Total current assets Non-current assets Receivables Investments accounted for using the equity method Intangibles Property, plant and equipment Deforred tax assets Employee benefits Other Total non-current assets Total assets Current liabilities Payables interest-bearing liabilities Current tax liabilities Employee benefits Provisions Total current liabilities Non-current liabilities Payables Interest bearing liabilities Employee benefits Provisions Total non-current liabilities Total llabilities Net assets Equity Issued capital Treasury stock Reserves Retained earnings Total parent entity interest Non-controlling interest Total equity 2.732,577 221,460 118,755 50,507 88,716 3,212,015 1,827,169 150,422 65,708 85,639 65,257 2,194,194 C7 C6 C5 D1 C7 C6 21,325 1,559,264 40,493 243,420 1,864,502 5,076,517 3,270,523 41.686 810,914 39,667 252,098 1.144,365 3,338,559 3,389,064 D6 502,626 (1.968) 19,331 2,737,021 3,257,010 13,513 3,270,523 524,944 (2.462) 11.168 2.842,357 3,376,007 13,057 3,389,064 Consolidated Statement of Changes in Equity FOR THE YEAR ENDED 31 DECEMBER 2013 Foreign currency Issued Treasury translation Medging capital stock reserve reserve Equity compen- sation Retained reserve earnings Non- controlling Interest Total Total equity Thousands of dollars Balance at 1 January 2019 Adjustment - Adoption of AASB 524,944 (2.462) 33,094 (2,065) (20,861) 2,842,357 3,376,007 13,057 3,389,064 16 (13,814) (13,814) 33,094 (1,065) (20,861) 2,828,543 3,362,193 (13,814) 3,375,250 13,057 382,763 382,763 1,056 383,819 9,806 (3,928) 2,554 8,432 8,432 9,806 (3,928) 385,317 391,195 1,056 392,251 1,288 (3,005) (3,005) - (4.787) 5,784 5,784 - (237,839) (260,157) - (239,000) (239,000) 5,784 (260,157) (600) (239,600) 42,900 (4,993) (18,576) 2,737,021 3,257,010 13,513 3,270,523 Restated balance at 1 January 2019 524,944 (2,462) Total comprehensive income for the year Profit for the year Total other comprehensive income Total comprehensive Income for the year Own shares acquired net of tax (4,293) Shares vested to employees 4,787 Expense on equity settled transactions Shares bought back (22,318) Dividends to shareholders Balance at 31 December 2019 502,626 (1,968) Balance at 1 January 2018 524,944 (1,210) Adjustment - Adoption of AASB 15 Restated balance at 1 January 2018 524,944 (1.210) Total comprehensive Income for the year Profit for the year Total other comprehensive income Total comprehensive Income for the year Own shares acquired net of tax (1,586) Shares vested to employees 334 Expense on equity settled transactions Dividends to shareholders Balance at 31 December 2018 524,944 (2,462) (12,912) (1,196) (25,403) 2,610,195 3,094,418 13,483 3,107,901 (18,542) (18,542) (18,542) (12,912) (1.196) (25,403) 2,591,653 3.075,876 13.483 3,089,359 560,416 560,416 1.174 561,590 46,006 131 (1,955) 44,182 44,182 46,006 131 558,461 604,598 1.174 605,772 476 11.110) (1.110) (334) 4.400 4,400 4,400 (307,757) (307,757) (1.600) (309,357) 33,094 (1,065) (20,861) 2,842,357 3,376,007 13,057 3,389,064 Consolidated Cash Flow Statement FOR THE YEAR ENDED 31 DECEMBER 2019 2019 2018 30,419,330 29,832,846 (29,385,609) (28,949,935) (4,293) (1,586) 450 400 1,341 2,622 (113,130) (52,000) (73,830) (235,843) 844,259 596,504 Thousands of dollars Note Cash flows from operating activities Receipts from customers Payments to suppliers, employees and governments Shares acquired for vesting employee benefits Dividends and disbursements received Interest received Interest and other finance costs paid Income taxes paid Net operating cash inflows 65.2 Cash flows from Investing activities Purchase of investment in associate Purchase of businesses, net of cash acquired Purchases of property, plant and equipment Major cyclical maintenance Purchases of intangibles Proceeds from sale of property, plant and equipment, net of selling costs Net Investing cash outflows Cash flows from financing activities Proceeds from borrowings Repayments of borrowings Repayment of lease principal Payments for shares bought back Dividends paid to non-controlling interest Dividends paid B5 Net financing cash outflows Net increase/(decrease in cash and cash equivalents Effect of exchange rate changes on cash and cash equivalents Increase/(decrease) in cash and cash equivalents Cash and cash equivalents at the beginning of the period Cash and cash equivalents at the end of the period G5.1 The Consolidated Cash Flow Statement is to be read in conjunction with the notes to the financial statements (184,259) (48,011) (48,421) 141,744 (138,947) (115,353) (1.174) (253,954) (38,516) (60,350) 43,774 (425,573) 7,465,193 (7,378,557) (212) 10,486,353 (10,556,076) (109,540) (260,157) (600) (239,000) (679,020) 26,292 2,581 28,873 6,142 35,015 (1.600) (307,757) (222,933) (52,002) 13,623 (38,379) 44,521 6,142 Requirement #1: Ch 2: Cash Flow Identify: Using the annual balance sheet and the Income Statement calculate the cash flow identify a) OCF b) NCS c) changes in NWC d) Is the Net working capital negative or positive? e) Does this indicate any potential difficulty for the company? f) CFA g) CFC h) is the Cash Flow to Creditors Negative? i) Explain how this might come about? j) What is the last total dividend pay? -refer to the Statement of Changes in Equity k) Did the company issue new shares? Yes or no. What is the total dollar value?-refer to the Statement of Changes in Equity 1) Did the company repurchase shares? Yes or no. What is the total dollar value? - refer to the Statement of Changes in Equity m) Based on the information above (from point "a" to "T"), what is your opinion in regards to the cash flow of your company? Requirement # 2: Ch 3: Ratio Analysis Using the financial statements of your assigned company, calculate each of following ratios listed below for the last two years. Calculate: a) Current ratio b) Quick Ratio c) Total Assets Turnover d) Total Debt Ratio = TD/TA e) Debt-Equity Ratio f) Long-Term Debt Ratio = LTD/LTD + TE) g) Times Interest earned = EBIT/Interest h) Cash-coverage ratio = (EBIT + Dep) / Interest 3 Consolidated Income Statement FOR THE YEAR ENDED 31 DECEMBER 2010 Note BI BI Thousands of dollars Revenue Cost of goods sold - historical cost Gross profit Other income Other expense Net foreign exchange gain/(loss) Selling and distribution expenses General and administration expenses Results from operating activities Finance costs 2019 2018 22,307,079 21,731,342 (20,388,737) (19,606,994) 1,918,342 2,124,348 44,728 12,555 (17,291) 3,654 (14,173) (1,122,243) (1,061,236) (207,224) (224,234) 637,257 819,969 (120,995) (51,872) 1,239 2,670 (119,756) (49,202) 4,231 10,133 521,732 780,900 (1.37,913) (219,310) 383,819 561,690 Finance income 82 F3.2 E1 Net finance costs Share of net profit of entities accounted for using the equity method Profit before Income tax expense Income tax expense Net profit Profit attributable to: Equity holders of the parent entity Non-controlling interest Net profit Basic and diluted earnings per shares Historical cost-cents per shore-basic Historical cost-cents per share-diluted The Consolidated Income Statement is to be read in conjunction with the notes to the financial statements 382,763 1,056 383,819 560,416 1,174 561,590 B4 151.3 151.1 214.9 214.9 34 Consolidated Statement of Comprehensive Income FOR THE YEAR ENDED 31 DECEMBER 2019 Note 2019 383,819 2018 561,590 E2.2 3,648 (1,094) 2,554 (2,793) 838 (1,955) Thousands of dollars Profit for the period Other comprehensive income Items that will not be reclassified to income statement: Actuarial gain/(loss) on defined benefit plans Tax on items that will not be reclassified to income statement Total Items that will not be reclassified to income statement Items that may be reclassified subsequently to Income statement: Foreign operations - foreign currency translation differences Not change in fair value of not investment hedges Effective portion of changes in fair value of cash flow hedges Net change in fair value of cash flow hedges reclassified to income statement Tax on items that may be reclassified subsequently to income statement Total items that may be reclassified subsequently to income statement Other comprehensive Income for the period, net of income tax Total comprehensive income for the period Attributable to: Equity holders of the parent entity Non-controlling interest Total comprehensive income for the period 11,006 (1,200) 4,463 (10,541) 2,150 5,878 8,432 392,251 52,618 (6,612) 10,442 (12,337) 2,026 46,137 44,182 605,772 391,195 1,056 392,251 604,598 1,174 605,772 The Consolidated Statement of Comprehensive Income is to be read in conjunction with the notes to the financial statements Consolidated Balance Sheet AS AT YEAR ENDED 1 DECEMBER 2012 Note 2019 2010 CI C2 35,015 1,479,240 2,109,505 34,234 3,657,994 6,142 1,184,025 1616,125 65.293 2,871585 F3 C3 8,709 154,902 573,199 2,702,452 177,758 3,988 68,038 4,689,046 1,347,040 8,081 147.442 554,219 2.889,863 184,260 1.721 C4 E2 C7 70,552 3,856,038 6,727,623 C5 DI Thousands of dollars Current assets Cash and cash equivalents Receivables Inventories Other Total current assets Non-current assets Receivables Investments accounted for using the equity method Intangibles Property, plant and equipment Deforred tax assets Employee benefits Other Total non-current assets Total assets Current liabilities Payables interest-bearing liabilities Current tax liabilities Employee benefits Provisions Total current liabilities Non-current liabilities Payables Interest bearing liabilities Employee benefits Provisions Total non-current liabilities Total llabilities Net assets Equity Issued capital Treasury stock Reserves Retained earnings Total parent entity interest Non-controlling interest Total equity 2.732,577 221,460 118,755 50,507 88,716 3,212,015 1,827,169 150,422 65,708 85,639 65,257 2,194,194 C7 C6 C5 D1 C7 C6 21,325 1,559,264 40,493 243,420 1,864,502 5,076,517 3,270,523 41.686 810,914 39,667 252,098 1.144,365 3,338,559 3,389,064 D6 502,626 (1.968) 19,331 2,737,021 3,257,010 13,513 3,270,523 524,944 (2.462) 11.168 2.842,357 3,376,007 13,057 3,389,064 Consolidated Statement of Changes in Equity FOR THE YEAR ENDED 31 DECEMBER 2013 Foreign currency Issued Treasury translation Medging capital stock reserve reserve Equity compen- sation Retained reserve earnings Non- controlling Interest Total Total equity Thousands of dollars Balance at 1 January 2019 Adjustment - Adoption of AASB 524,944 (2.462) 33,094 (2,065) (20,861) 2,842,357 3,376,007 13,057 3,389,064 16 (13,814) (13,814) 33,094 (1,065) (20,861) 2,828,543 3,362,193 (13,814) 3,375,250 13,057 382,763 382,763 1,056 383,819 9,806 (3,928) 2,554 8,432 8,432 9,806 (3,928) 385,317 391,195 1,056 392,251 1,288 (3,005) (3,005) - (4.787) 5,784 5,784 - (237,839) (260,157) - (239,000) (239,000) 5,784 (260,157) (600) (239,600) 42,900 (4,993) (18,576) 2,737,021 3,257,010 13,513 3,270,523 Restated balance at 1 January 2019 524,944 (2,462) Total comprehensive income for the year Profit for the year Total other comprehensive income Total comprehensive Income for the year Own shares acquired net of tax (4,293) Shares vested to employees 4,787 Expense on equity settled transactions Shares bought back (22,318) Dividends to shareholders Balance at 31 December 2019 502,626 (1,968) Balance at 1 January 2018 524,944 (1,210) Adjustment - Adoption of AASB 15 Restated balance at 1 January 2018 524,944 (1.210) Total comprehensive Income for the year Profit for the year Total other comprehensive income Total comprehensive Income for the year Own shares acquired net of tax (1,586) Shares vested to employees 334 Expense on equity settled transactions Dividends to shareholders Balance at 31 December 2018 524,944 (2,462) (12,912) (1,196) (25,403) 2,610,195 3,094,418 13,483 3,107,901 (18,542) (18,542) (18,542) (12,912) (1.196) (25,403) 2,591,653 3.075,876 13.483 3,089,359 560,416 560,416 1.174 561,590 46,006 131 (1,955) 44,182 44,182 46,006 131 558,461 604,598 1.174 605,772 476 11.110) (1.110) (334) 4.400 4,400 4,400 (307,757) (307,757) (1.600) (309,357) 33,094 (1,065) (20,861) 2,842,357 3,376,007 13,057 3,389,064 Consolidated Cash Flow Statement FOR THE YEAR ENDED 31 DECEMBER 2019 2019 2018 30,419,330 29,832,846 (29,385,609) (28,949,935) (4,293) (1,586) 450 400 1,341 2,622 (113,130) (52,000) (73,830) (235,843) 844,259 596,504 Thousands of dollars Note Cash flows from operating activities Receipts from customers Payments to suppliers, employees and governments Shares acquired for vesting employee benefits Dividends and disbursements received Interest received Interest and other finance costs paid Income taxes paid Net operating cash inflows 65.2 Cash flows from Investing activities Purchase of investment in associate Purchase of businesses, net of cash acquired Purchases of property, plant and equipment Major cyclical maintenance Purchases of intangibles Proceeds from sale of property, plant and equipment, net of selling costs Net Investing cash outflows Cash flows from financing activities Proceeds from borrowings Repayments of borrowings Repayment of lease principal Payments for shares bought back Dividends paid to non-controlling interest Dividends paid B5 Net financing cash outflows Net increase/(decrease in cash and cash equivalents Effect of exchange rate changes on cash and cash equivalents Increase/(decrease) in cash and cash equivalents Cash and cash equivalents at the beginning of the period Cash and cash equivalents at the end of the period G5.1 The Consolidated Cash Flow Statement is to be read in conjunction with the notes to the financial statements (184,259) (48,011) (48,421) 141,744 (138,947) (115,353) (1.174) (253,954) (38,516) (60,350) 43,774 (425,573) 7,465,193 (7,378,557) (212) 10,486,353 (10,556,076) (109,540) (260,157) (600) (239,000) (679,020) 26,292 2,581 28,873 6,142 35,015 (1.600) (307,757) (222,933) (52,002) 13,623 (38,379) 44,521 6,142
Step by Step Solution
There are 3 Steps involved in it

Get step-by-step solutions from verified subject matter experts