

Question: Requirement 1. Prepare a vertical analysis for McConnell for both its income statement and balance sheet. Begin by preparing a vertical analysis for McConnell for
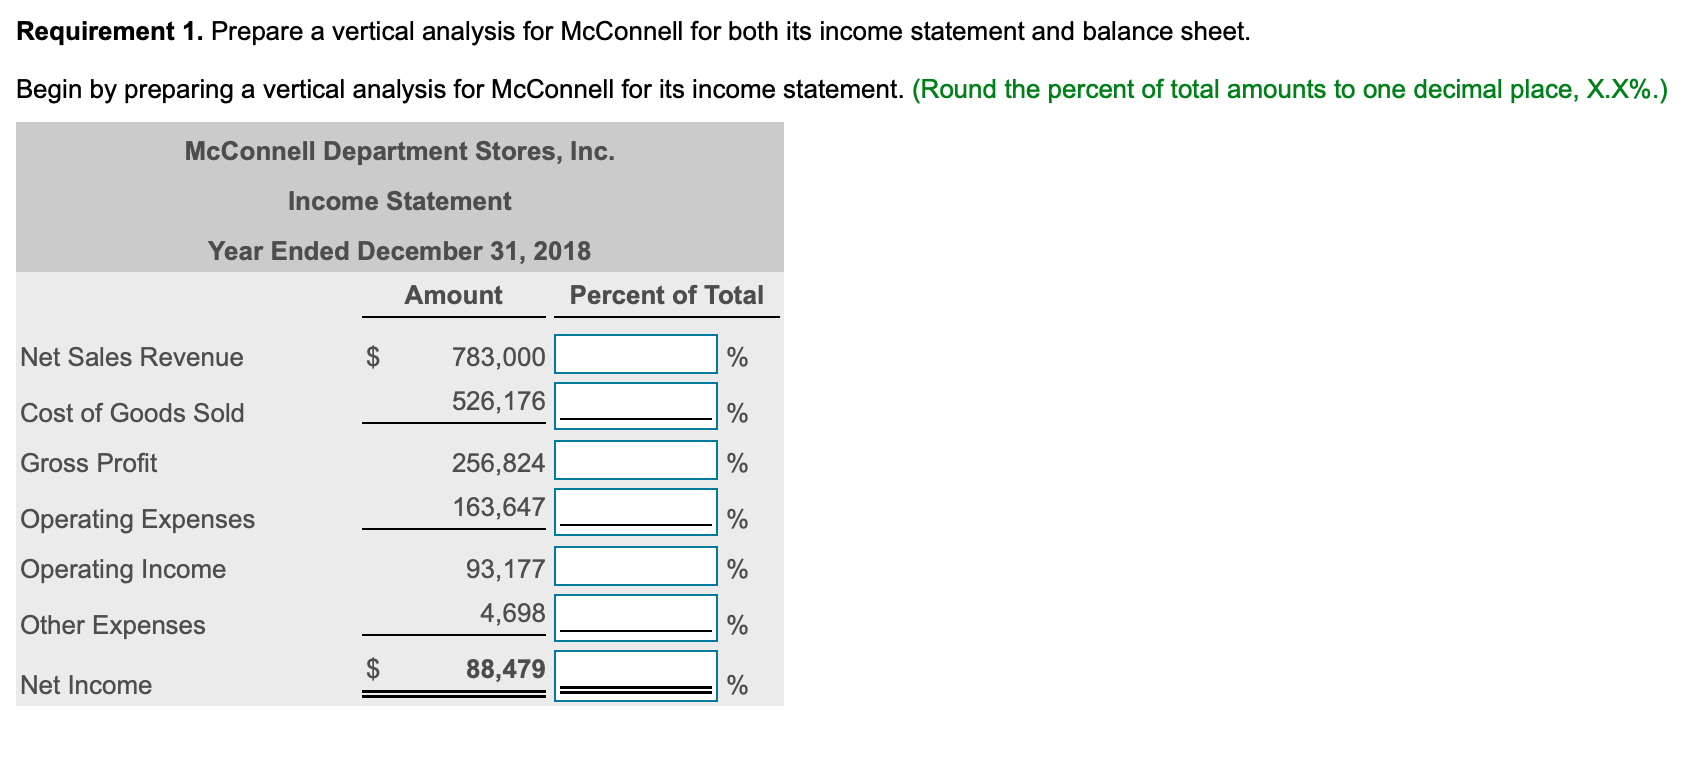
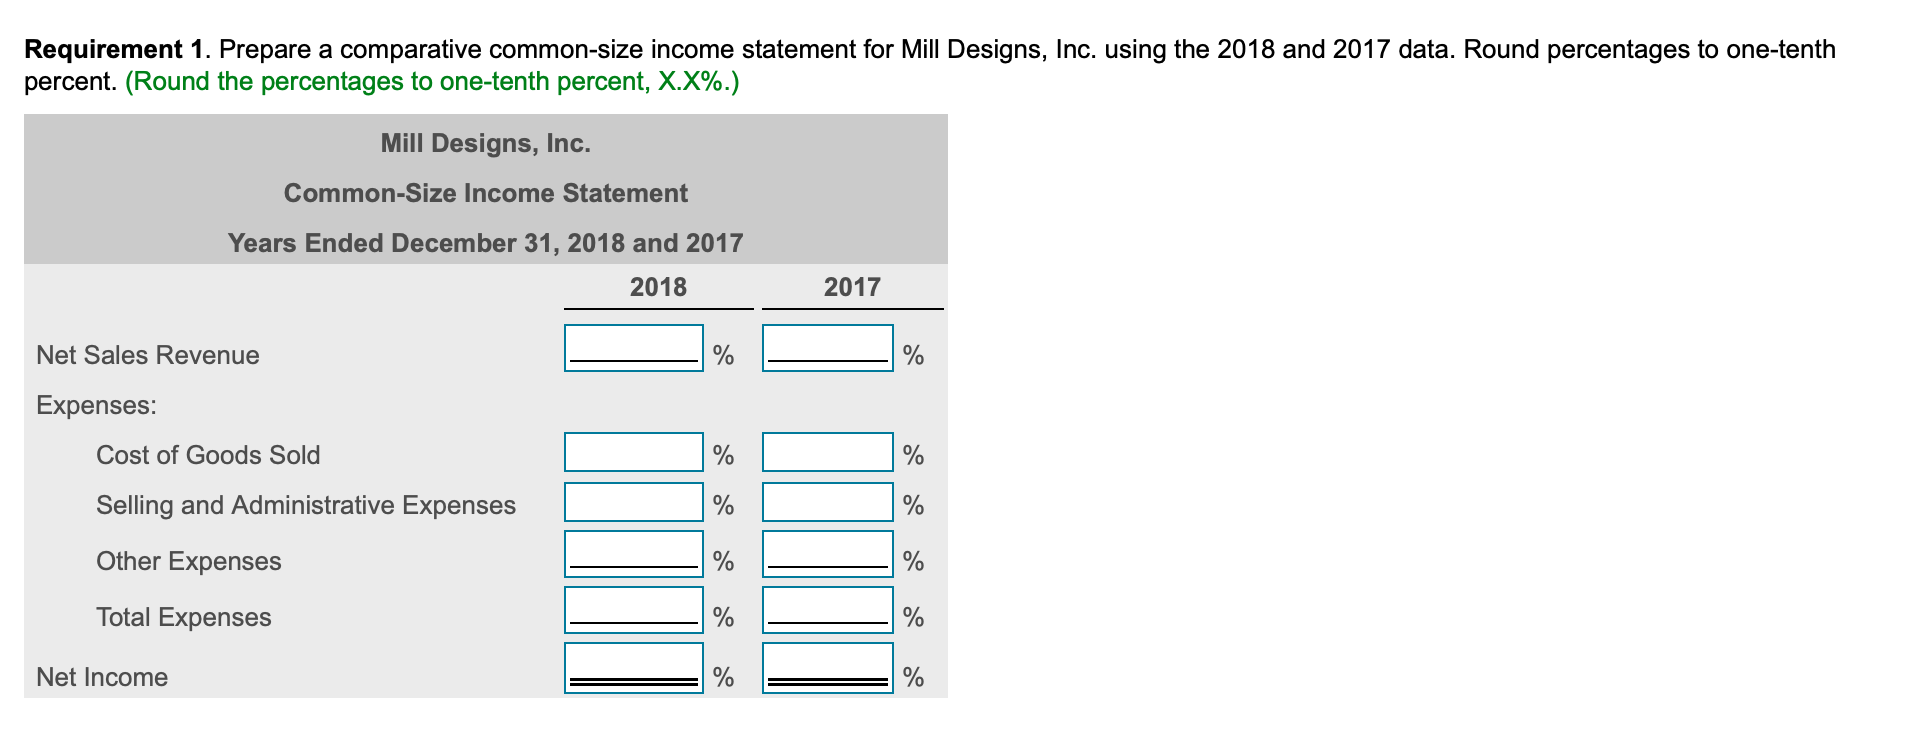
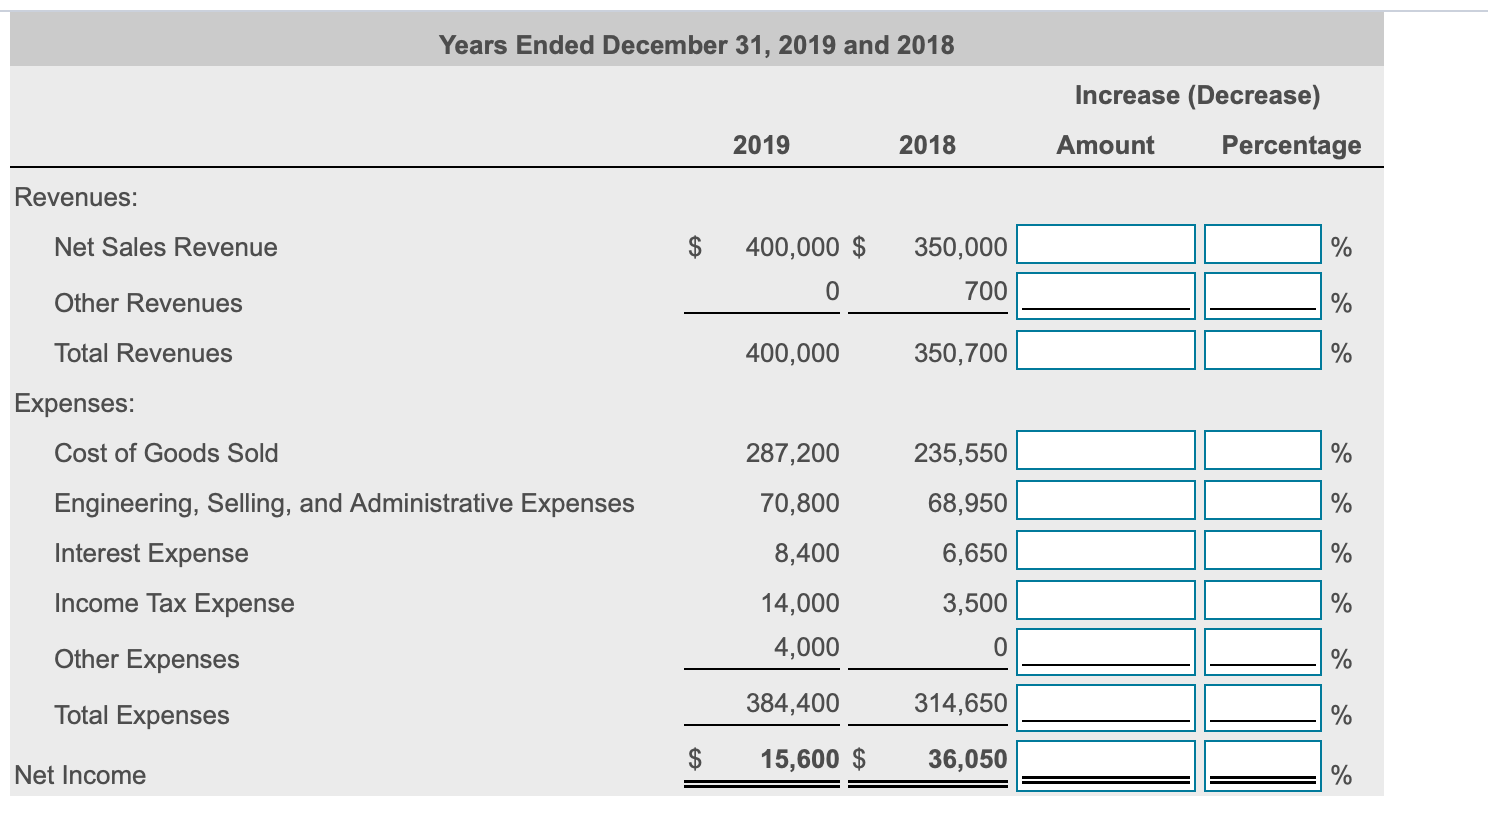
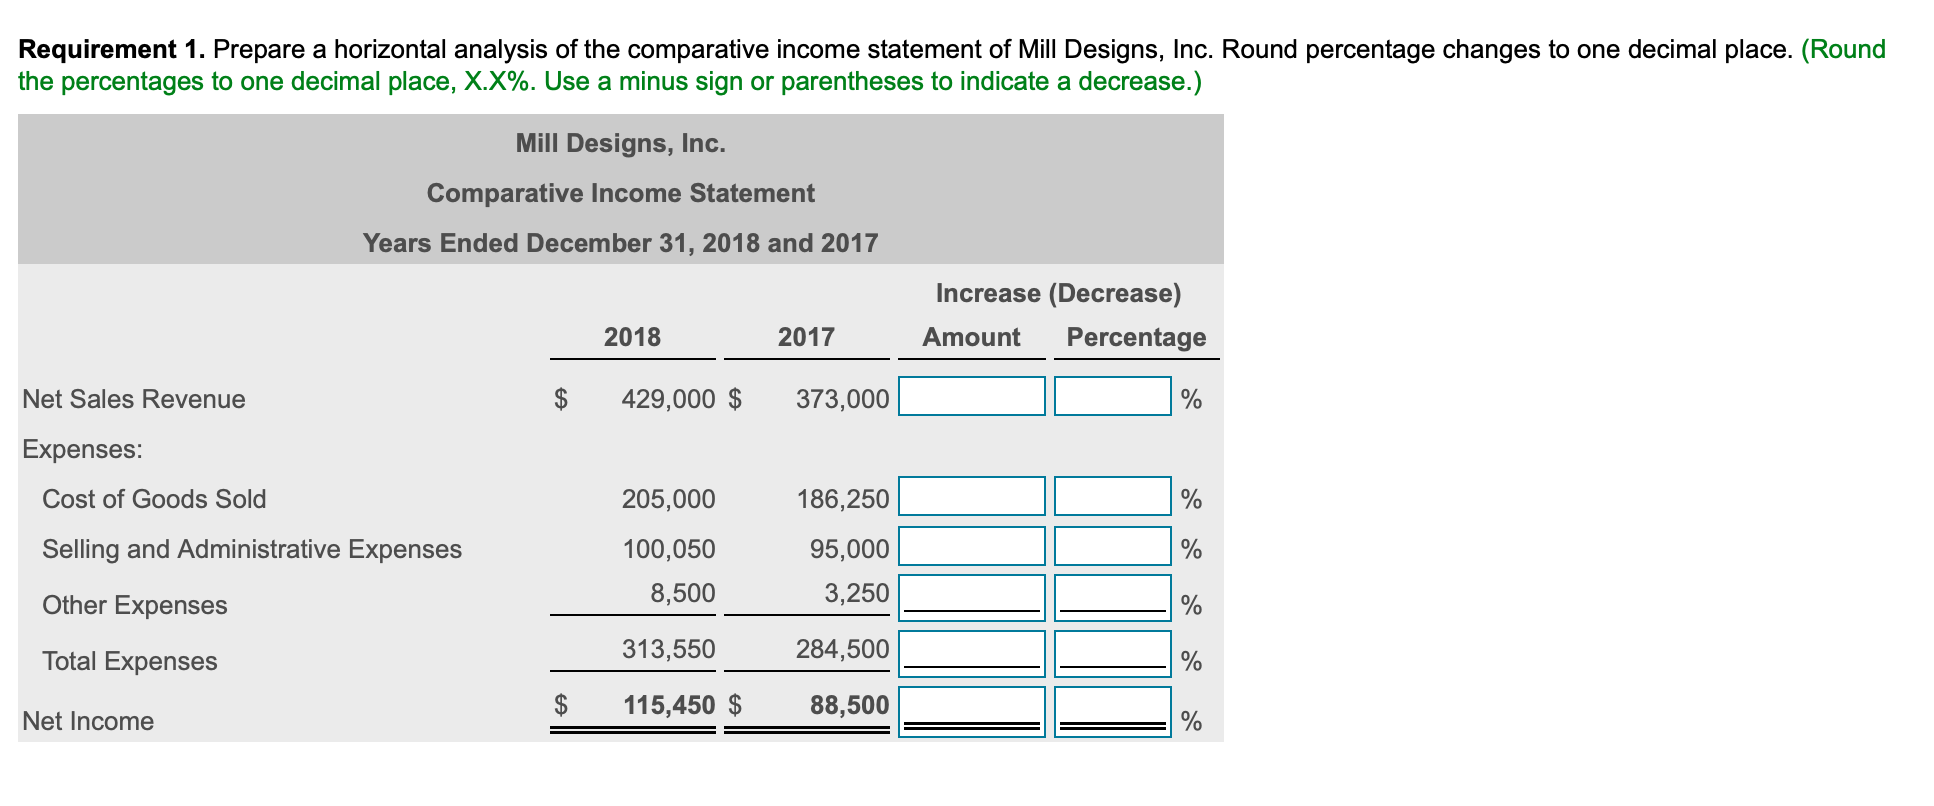
Requirement 1. Prepare a vertical analysis for McConnell for both its income statement and balance sheet. Begin by preparing a vertical analysis for McConnell for its income statement. (Round the percent of total amounts to one decimal place, X.X%.) McConnell Department Stores, Inc. Income Statement Year Ended December 31, 2018 Amount Percent of Total Net Sales Revenue $ % 783,000 526,176 Cost of Goods Sold % Gross Profit % 256,824 163,647 % Operating Expenses Operating Income % 93,177 4,698 Other Expenses % $ 88,479 Net Income % Requirement 1. Prepare a comparative common-size income statement for Mill Designs, Inc. using the 2018 and 2017 data. Round percentages to one-tenth percent. (Round the percentages to one-tenth percent, X.X%.) Mill Designs, Inc. Common-Size Income Statement Years Ended December 31, 2018 and 2017 2018 2017 Net Sales Revenue % % Expenses: Cost of Goods Sold % % Selling and Administrative Expenses % % Other Expenses % % Total Expenses % % Net Income % Years Ended December 31, 2019 and 2018 Increase (Decrease) Amount Percentage 2019 2018 Revenues: Net Sales Revenue $ 400,000 $ % 350,000 700 0 Other Revenues % Total Revenues 400,000 350,700 % Expenses: Cost of Goods Sold 287,200 235,550 % 70,800 68,950 % Engineering, Selling, and Administrative Expenses Interest Expense Income Tax Expense 8,400 6,650 % 3,500 % 14,000 4,000 0 Other Expenses % Total Expenses 384,400 314,650 % $ 15,600 $ 36,050 Net Income % Requirement 1. Prepare a horizontal analysis of the comparative income statement of Mill Designs, Inc. Round percentage changes to one decimal place. (Round the percentages to one decimal place, X.X%. Use a minus sign or parentheses to indicate a decrease.) Mill Designs, Inc. Comparative Income Statement Years Ended December 31, 2018 and 2017 Increase (Decrease) Amount Percentage 2018 2017 Net Sales Revenue $ 429,000 $ 373,000 % Expenses: Cost of Goods Sold 205,000 % Selling and Administrative Expenses 186,250 95,000 3,250 100,050 8,500 % Other Expenses Total Expenses 313,550 284,500 % $ 115,450 $ 88,500 Net Income %
Step by Step Solution
There are 3 Steps involved in it

Get step-by-step solutions from verified subject matter experts