

Question: Requirement 1. Prepare the income statement performance report. Note: The master budget was based on expected sales volume of 65,000 bubble kits. (For accounts with
Requirement 1. Prepare the income statement performance report. Note: The master budget was based on expected sales volume of 65,000 bubble kits. (For accounts with a 0 balance, make sure to enter "0" in the appropriate column. Label each variance as favorable (F) or unfavorable (U). A variance of zero is considered favorable.)
Requirement 2. What accounts for most of the difference between actual operating income and master budget operating income?
Requirement 3. What is Blowing Bubbles' master budget variance for operating income? Explain why the income statement performance report provides Blowing Bubbles' managers with more useful information than the simple master budget variance. What insights can Blowing Bubbles' managers draw from this performance report?
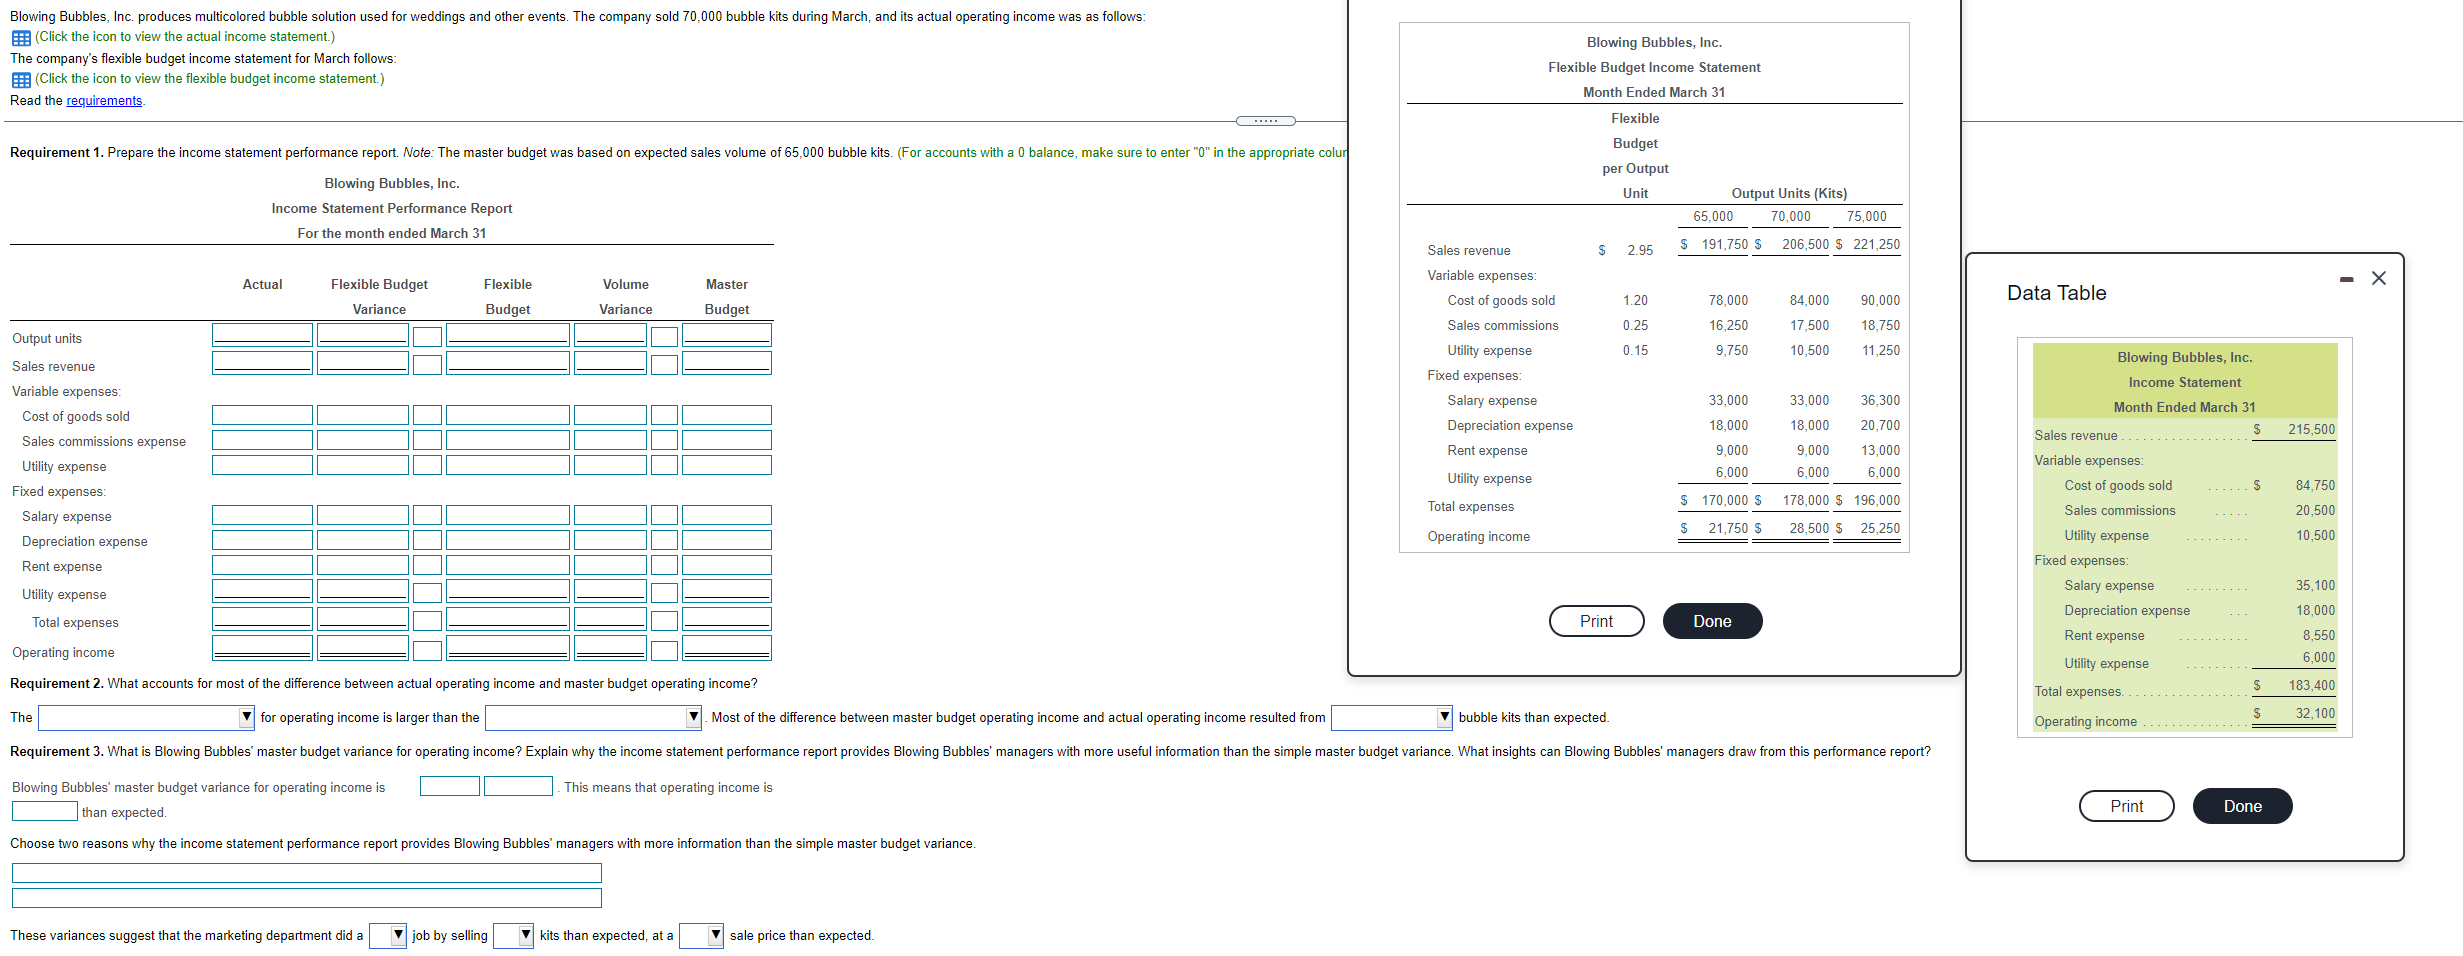
Blowing Bubbles, Inc. produces multicolored bubble solution used for weddings and other events. The company sold 70,000 bubble kits during March, and its actual operating income was as follows: (Click the icon to view the actual income statement.) The company's flexible budget income statement for March follows: Click the icon to view the flexible budget income statement.) Read the requirements Blowing Bubbles, Inc. Flexible Budget Income Statement Month Ended March 31 Flexible Requirement 1. Prepare the income statement performance report. Note: The master budget was based on expected sales volume of 65,000 bubble kits. (For accounts with a 0 balance, make sure to enter "0" in the appropriate colur Budget per Output Unit Blowing Bubbles, Inc. Income Statement Performance Report For the month ended March 31 Output Units (Kits) 65,000 70,000 75,000 Sales revenue $ 2.95 $ 191,750 $ 206,500 $ 221,250 Actual Flexible Volume Master - X Flexible Budget Variance Variable expenses Cost of goods sold Sales commissions 1.20 78,000 84.000 90,000 Data Table Budget Variance Budget 0.25 16.250 17,500 18,750 Output units 0.15 9,750 10,500 11.250 Sales revenue Utility expense Fixed expenses: Salary expense Depreciation expense Rent expense 36,300 33,000 18,000 33,000 18,000 215,500 Blowing Bubbles, Inc. Income Statement Month Ended March 31 $ Sales revenue Variable expenses Cost of goods sold $ Sales commissions 9,000 6,000 Variable expenses Cost of goods sold Sales commissions expense Utility expense Fixed expenses Salary expense Depreciation expense Rent expense 20,700 13,000 6,000 9,000 6,000 Utility expense 84.750 Total expenses $ 170,000 $ 178,000 $ 196,000 28,500 $ 25,250 20,500 $ 21,750 $ Operating income 10.500 Utility expense Fixed expenses Salary expense Depreciation expense Rent expense 35,100 Utility expense Total expenses Print Done 18,000 8,550 6,000 Operating income Requirement 2. What accounts for most of the difference between actual operating income and master budget operating income? 183.400 Utility expense $ Total expenses $ Operating income ............... The Most of the difference between master budget operating income and actual operating income resulted from for operating income is larger than the bubble kits than expected. 32,100 Requirement 3. What is Blowing Bubbles' master budget variance for operating income? Explain why the income statement performance report provides Blowing Bubbles' managers with more useful information than the simple master budget variance. What insights can Blowing Bubbles' managers draw from this performance report? This means that operating income is Blowing Bubbles' master budget variance for operating income is than expected Print Done Choose two reasons why the income statement performance report provides Blowing Bubbles' managers with more information than the simple master budget variance. These variances suggest that the marketing department did a v job by selling kits than expected, at a sale price than expected
Step by Step Solution
There are 3 Steps involved in it

Get step-by-step solutions from verified subject matter experts