

Question: requirement 2 Consider how Pine Vailey, a popular ski resort, could use capital budgeting to decide whether the $9 million Waterfall Park Lodge expansion would
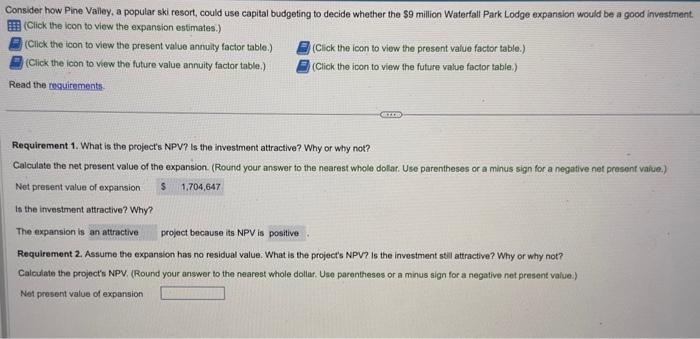
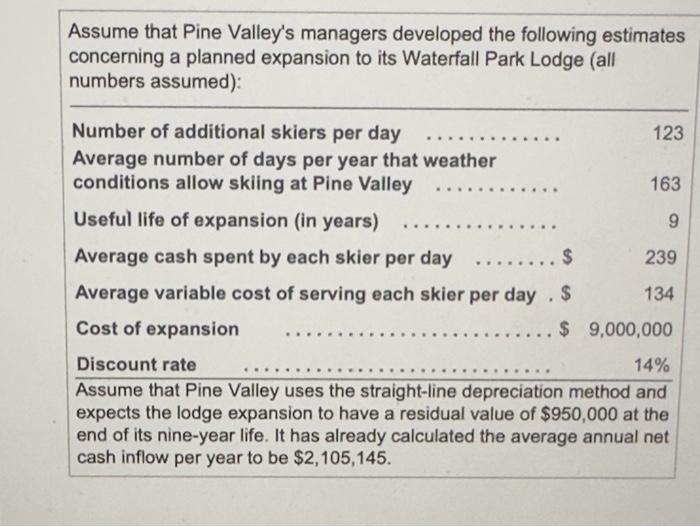
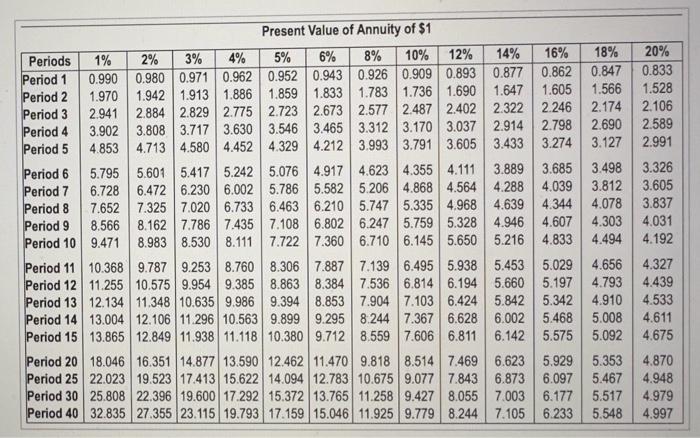
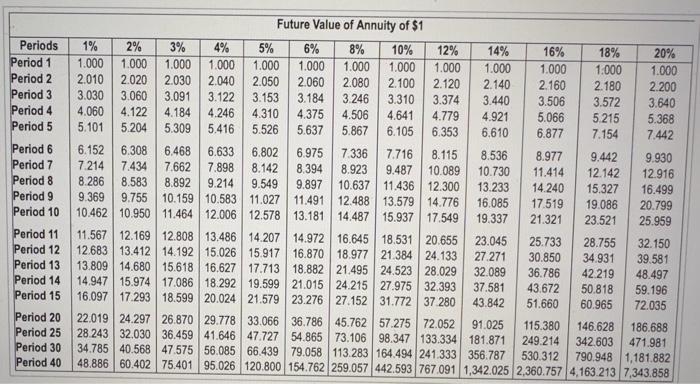
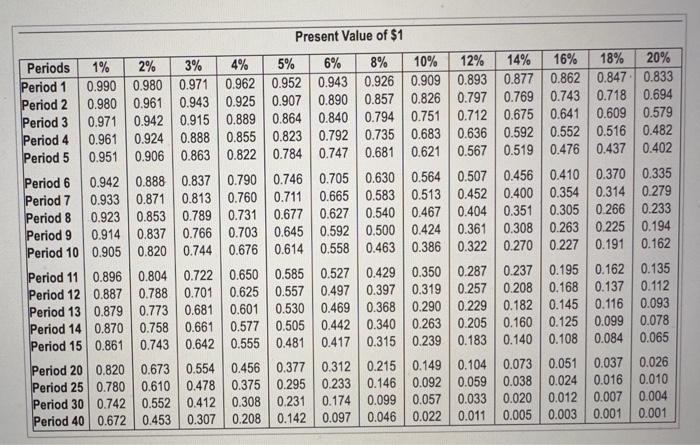
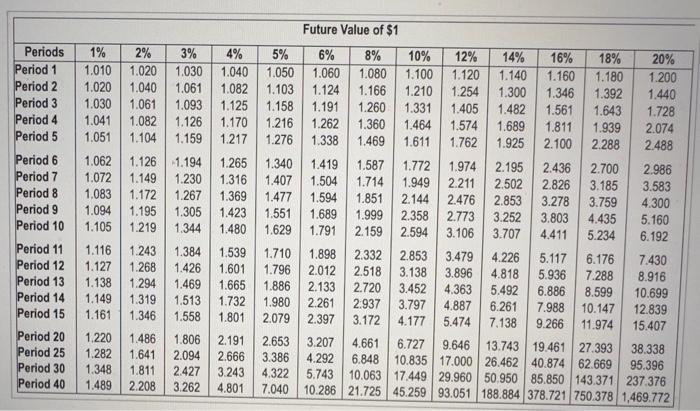
Consider how Pine Vailey, a popular ski resort, could use capital budgeting to decide whether the $9 million Waterfall Park Lodge expansion would be a good investment. (Click the koon to viow the expansion estimates.) (Click the icon to view the present value annuity factor table.) (Click the icon to view the present value factor table.) (Click the icon to view the future value annuity factor table.) (Click the icon to view the future value factor table.) Read the toquirements. Requirement 1. What is the project's NPV? is the investment attractive? Why or why not? Calculate the net present value of the expansion. (Round your answer to the nearest whole dolar. Use parentheses or a minus sign for a negative net present vaike.) Net present value of expansion is the investment attractive? Why? The expansion is project because its NPV is Requirement 2. Assume the expansion has no residual value. What is the project's NPV? is the investment stil attractive? Why or why not? Calculate the project's NPV. (Round your answer to the nearest whole dollar. Use parentheses or a minus sign for a negative net present value.) Net present value of expansion Assume that Pine Valley's managers developed the following estimates concerning a planned expansion to its Waterfall Park Lodge (all numbers assumed): Number of additional skiers per day Average number of days per year that weather conditions allow skiing at Pine Valley.. Useful life of expansion (in years)...9 Average cash spent by each skier per day .....$239 Average variable cost of serving each skier per day . \$ 134 Discount rate .14% Assume that Pine Valley uses the straight-line depreciation method and expects the lodge expansion to have a residual value of $950,000 at the end of its nine-year life. It has already calculated the average annual net cash inflow per year to be $2,105,145. Present Value of Annuity of $1 \begin{tabular}{|l|c|c|c|c|c|c|c|c|c|c|c|c|c|} \hline Periods & 1% & 2% & 3% & 4% & 5% & 6% & 8% & 10% & 12% & 14% & 16% & 18% & 20% \\ \hline Period 1 & 0.990 & 0.980 & 0.971 & 0.962 & 0.952 & 0.943 & 0.926 & 0.909 & 0.893 & 0.877 & 0.862 & 0.847 & 0.833 \\ Period 2 & 1.970 & 1.942 & 1.913 & 1.886 & 1.859 & 1.833 & 1.783 & 1.736 & 1.690 & 1.647 & 1.605 & 1.566 & 1.528 \\ Period 3 & 2.941 & 2.884 & 2.829 & 2.775 & 2.723 & 2.673 & 2.577 & 2.487 & 2.402 & 2.322 & 2.246 & 2.174 & 2.106 \\ Period 4 & 3.902 & 3.808 & 3.717 & 3.630 & 3.546 & 3.465 & 3.312 & 3.170 & 3.037 & 2.914 & 2.798 & 2.690 & 2.589 \\ Period 5 & 4.853 & 4.713 & 4.580 & 4.452 & 4.329 & 4.212 & 3.993 & 3.791 & 3.605 & 3.433 & 3.274 & 3.127 & 2.991 \\ Period 6 & 5.795 & 5.601 & 5.417 & 5.242 & 5.076 & 4.917 & 4.623 & 4.355 & 4.111 & 3.889 & 3.685 & 3.498 & 3.326 \\ Period 7 & 6.728 & 6.472 & 6.230 & 6.002 & 5.786 & 5.582 & 5.206 & 4.868 & 4.564 & 4.288 & 4.039 & 3.812 & 3.605 \\ Period 8 & 7.652 & 7.325 & 7.020 & 6.733 & 6.463 & 6.210 & 5.747 & 5.335 & 4.968 & 4.639 & 4.344 & 4.078 & 3.837 \\ Period 9 & 8.566 & 8.162 & 7.786 & 7.435 & 7.108 & 6.802 & 6.247 & 5.759 & 5.328 & 4.946 & 4.607 & 4.303 & 4.031 \\ Period 10 & 9.471 & 8.983 & 8.530 & 8.111 & 7.722 & 7.360 & 6.710 & 6.145 & 5.650 & 5.216 & 4.833 & 4.494 & 4.192 \\ Period 11 & 10.368 & 9.787 & 9.253 & 8.760 & 8.306 & 7.887 & 7.139 & 6.495 & 5.938 & 5.453 & 5.029 & 4.656 & 4.327 \\ Period 12 & 11.255 & 10.575 & 9.954 & 9.385 & 8.863 & 8.384 & 7.536 & 6.814 & 6.194 & 5.660 & 5.197 & 4.793 & 4.439 \\ Period 13 & 12.134 & 11.348 & 10.635 & 9.986 & 9.394 & 8.853 & 7.904 & 7.103 & 6.424 & 5.842 & 5.342 & 4.910 & 4.533 \\ Period 14 & 13.004 & 12.106 & 11.296 & 10.563 & 9.899 & 9.295 & 8.244 & 7.367 & 6.628 & 6.002 & 5.468 & 5.008 & 4.611 \\ Period 15 & 13.865 & 12.849 & 11.938 & 11.118 & 10.380 & 9.712 & 8.559 & 7.606 & 6.811 & 6.142 & 5.575 & 5.092 & 4.675 \\ Period 20 & 18.046 & 16.351 & 14.877 & 13.590 & 12.462 & 11.470 & 9.818 & 8.514 & 7.469 & 6.623 & 5.929 & 5.353 & 4.870 \\ Period 25 & 22.023 & 19.523 & 17.413 & 15.622 & 14.094 & 12.783 & 10.675 & 9.077 & 7.843 & 6.873 & 6.097 & 5.467 & 4.948 \\ Period 30 & 25.808 & 22.396 & 19.600 & 17.292 & 15.372 & 13.765 & 11.258 & 9.427 & 8.055 & 7.003 & 6.177 & 5.517 \\ Period 40 & 32.835 & 27.355 & 23.115 & 19.793 & 17.159 & 15.046 & 11.925 & 9.779 & 8.244 & 7.105 & 6.233 & 5.548 & 4.997 \\ \hline \end{tabular} Future Value of Annuity of $1 Present Value of $1 \begin{tabular}{|l|c|c|c|c|c|c|c|c|c|c|c|c|c|} \hline Periods & 1% & 2% & 3% & 4% & 5% & 6% & 8% & 10% & 12% & 14% & 16% & 18% & 20% \\ \hline Period 1 & 0.990 & 0.980 & 0.971 & 0.962 & 0.952 & 0.943 & 0.926 & 0.909 & 0.893 & 0.877 & 0.862 & 0.847 & 0.833 \\ Period 2 & 0.980 & 0.961 & 0.943 & 0.925 & 0.907 & 0.890 & 0.857 & 0.826 & 0.797 & 0.769 & 0.743 & 0.718 & 0.694 \\ Period 3 & 0.971 & 0.942 & 0.915 & 0.889 & 0.864 & 0.840 & 0.794 & 0.751 & 0.712 & 0.675 & 0.641 & 0.609 & 0.579 \\ Period 4 & 0.961 & 0.924 & 0.888 & 0.855 & 0.823 & 0.792 & 0.735 & 0.683 & 0.636 & 0.592 & 0.552 & 0.516 & 0.482 \\ Period 5 & 0.951 & 0.906 & 0.863 & 0.822 & 0.784 & 0.747 & 0.681 & 0.621 & 0.567 & 0.519 & 0.476 & 0.437 & 0.402 \\ Period 6 & 0.942 & 0.888 & 0.837 & 0.790 & 0.746 & 0.705 & 0.630 & 0.564 & 0.507 & 0.456 & 0.410 & 0.370 & 0.335 \\ Period 7 & 0.933 & 0.871 & 0.813 & 0.760 & 0.711 & 0.665 & 0.583 & 0.513 & 0.452 & 0.400 & 0.354 & 0.314 & 0.279 \\ Period 8 & 0.923 & 0.853 & 0.789 & 0.731 & 0.677 & 0.627 & 0.540 & 0.467 & 0.404 & 0.351 & 0.305 & 0.266 & 0.233 \\ Period 9 & 0.914 & 0.837 & 0.766 & 0.703 & 0.645 & 0.592 & 0.500 & 0.424 & 0.361 & 0.308 & 0.263 & 0.225 & 0.194 \\ Period 10 & 0.905 & 0.820 & 0.744 & 0.676 & 0.614 & 0.558 & 0.463 & 0.386 & 0.322 & 0.270 & 0.227 & 0.191 & 0.162 \\ Period 11 & 0.896 & 0.804 & 0.722 & 0.650 & 0.585 & 0.527 & 0.429 & 0.350 & 0.287 & 0.237 & 0.195 & 0.162 & 0.135 \\ Period 12 & 0.887 & 0.788 & 0.701 & 0.625 & 0.557 & 0.497 & 0.397 & 0.319 & 0.257 & 0.208 & 0.168 & 0.137 & 0.112 \\ Period 13 & 0.879 & 0.773 & 0.681 & 0.601 & 0.530 & 0.469 & 0.368 & 0.290 & 0.229 & 0.182 & 0.145 & 0.116 & 0.093 \\ Period 14 & 0.870 & 0.758 & 0.661 & 0.577 & 0.505 & 0.442 & 0.340 & 0.263 & 0.205 & 0.160 & 0.125 & 0.099 & 0.078 \\ Period 15 & 0.861 & 0.743 & 0.642 & 0.555 & 0.481 & 0.417 & 0.315 & 0.239 & 0.183 & 0.140 & 0.108 & 0.084 & 0.065 \\ Period 20 & 0.820 & 0.673 & 0.554 & 0.456 & 0.377 & 0.312 & 0.215 & 0.149 & 0.104 & 0.073 & 0.051 & 0.037 & 0.026 \\ Period 25 & 0.780 & 0.610 & 0.478 & 0.375 & 0.295 & 0.233 & 0.146 & 0.092 & 0.059 & 0.038 & 0.024 & 0.016 & 0.010 \\ Period 30 & 0.742 & 0.552 & 0.412 & 0.308 & 0.231 & 0.174 & 0.099 & 0.057 & 0.033 & 0.020 & 0.012 & 0.007 & 0.004 \\ Period 40 & 0.672 & 0.453 & 0.307 & 0.208 & 0.142 & 0.097 & 0.046 & 0.022 & 0.011 & 0.005 & 0.003 & 0.001 & 0.001 \\ \hline \end{tabular} Future Value of $1 \begin{tabular}{|l|c|c|c|c|c|c|c|c|c|c|c|c|c|} \hline Periods & 1% & 2% & 3% & 4% & 5% & 6% & 8% & 10% & 12% & 14% & 16% & 18% & 20% \\ \hline Period 1 & 1.010 & 1.020 & 1.030 & 1.040 & 1.050 & 1.060 & 1.080 & 1.100 & 1.120 & 1.140 & 1.160 & 1.180 & 1.200 \\ Period 2 & 1.020 & 1.040 & 1.061 & 1.082 & 1.103 & 1.124 & 1.166 & 1.210 & 1.254 & 1.300 & 1.346 & 1.392 & 1.440 \\ Period 3 & 1.030 & 1.061 & 1.093 & 1.125 & 1.158 & 1.191 & 1.260 & 1.331 & 1.405 & 1.482 & 1.561 & 1.643 & 1.728 \\ Period 4 & 1.041 & 1.082 & 1.126 & 1.170 & 1.216 & 1.262 & 1.360 & 1.464 & 1.574 & 1.689 & 1.811 & 1.939 & 2.074 \\ Period 5 & 1.051 & 1.104 & 1.159 & 1.217 & 1.276 & 1.338 & 1.469 & 1.611 & 1.762 & 1.925 & 2.100 & 2.288 & 2.488 \\ Period 6 & 1.062 & 1.126 & 1.194 & 1.265 & 1.340 & 1.419 & 1.587 & 1.772 & 1.974 & 2.195 & 2.436 & 2.700 & 2.986 \\ Period 7 & 1.072 & 1.149 & 1.230 & 1.316 & 1.407 & 1.504 & 1.714 & 1.949 & 2.211 & 2.502 & 2.826 & 3.185 & 3.583 \\ Period 8 & 1.083 & 1.172 & 1.267 & 1.369 & 1.477 & 1.594 & 1.851 & 2.144 & 2.476 & 2.853 & 3.278 & 3.759 & 4.300 \\ Period 9 & 1.094 & 1.195 & 1.305 & 1.423 & 1.551 & 1.689 & 1.999 & 2.358 & 2.773 & 3.252 & 3.803 & 4.435 & 5.160 \\ Period 10 & 1.105 & 1.219 & 1.344 & 1.480 & 1.629 & 1.791 & 2.159 & 2.594 & 3.106 & 3.707 & 4.411 & 5.234 & 6.192 \\ Period 11 & 1.116 & 1.243 & 1.384 & 1.539 & 1.710 & 1.898 & 2.332 & 2.853 & 3.479 & 4.226 & 5.117 & 6.176 & 7.430 \\ Period 12 & 1.127 & 1.268 & 1.426 & 1.601 & 1.796 & 2.012 & 2.518 & 3.138 & 3.896 & 4.818 & 5.936 & 7.288 & 8.916 \\ Period 13 & 1.138 & 1.294 & 1.469 & 1.665 & 1.886 & 2.133 & 2.720 & 3.452 & 4.363 & 5.492 & 6.886 & 8.599 & 10.699 \\ Period 14 & 1.149 & 1.319 & 1.513 & 1.732 & 1.980 & 2.261 & 2.937 & 3.797 & 4.887 & 6.261 & 7.988 & 10.147 & 12.839 \\ Period 15 & 1.161 & 1.346 & 1.558 & 1.801 & 2.079 & 2.397 & 3.172 & 4.177 & 5.474 & 7.138 & 9.266 & 11.974 & 15.407 \\ Period 20 & 1.220 & 1.486 & 1.806 & 2.191 & 2.653 & 3.207 & 4.661 & 6.727 & 9.646 & 13.743 & 19.461 & 27.393 & 38.338 \\ Period 25 & 1.282 & 1.641 & 2.094 & 2.666 & 3.386 & 4.292 & 6.848 & 10.835 & 17.000 & 26.462 & 40.874 & 62.669 & 95.396 \\ Period 30 & 1.348 & 1.811 & 2.427 & 3.243 & 4.322 & 5.743 & 10.063 & 17.449 & 29.960 & 50.950 & 85.850 & 143.371 & 237.376 \\ Period 40 & 1.489 & 2.208 & 3.262 & 4.801 & 7.040 & 10.286 & 21.725 & 45.259 & 93.051 & 188.884 & 378.721 & 750.378 & 1.469 .772 \\ \hline \end{tabular}
Step by Step Solution
There are 3 Steps involved in it

Get step-by-step solutions from verified subject matter experts