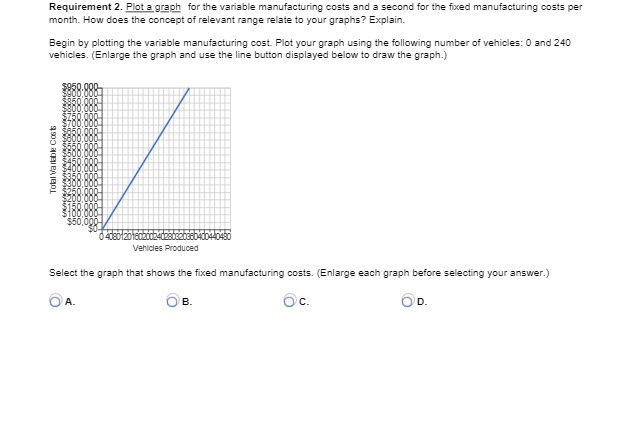
Question: Requirement 2. Plot a graph for the variable manufacturing costs and a second for the fixed manufacturing costs per month. How does the concept of

Requirement 2. Plot a graph for the variable
Requirement 2. Plot a graph for the variable manufacturing costs and a second for the fixed manufacturing costs per month. How does the concept of relevant range relate to your graphs? Explain. Begin by plotting the variable manufacturing cost. Plot your graph using the following number of vehicles: 0 and 240 vehicles. (Enlarge the graph and use the line button displayed below to draw the graph.) Total Varibe Cost Vehicles Produced Select the graph that shows the fixed manufacturing costs. (Enlarge each graph before selecting your answer.) OA. OB. Oc. O'D

Step by Step Solution

There are 3 Steps involved in it

1 Expert Approved Answer
Step: 1 Unlock blur-text-image
Question Has Been Solved by an Expert!

Get step-by-step solutions from verified subject matter experts

Step: 2 Unlock
Step: 3 Unlock

Students Have Also Explored These Related Accounting Questions!