

Question: Requirement Continuing from milestone #3, you will use Excel to develop dashboards to present the data in SSAS An SSAS database (with a multidimensional cube)
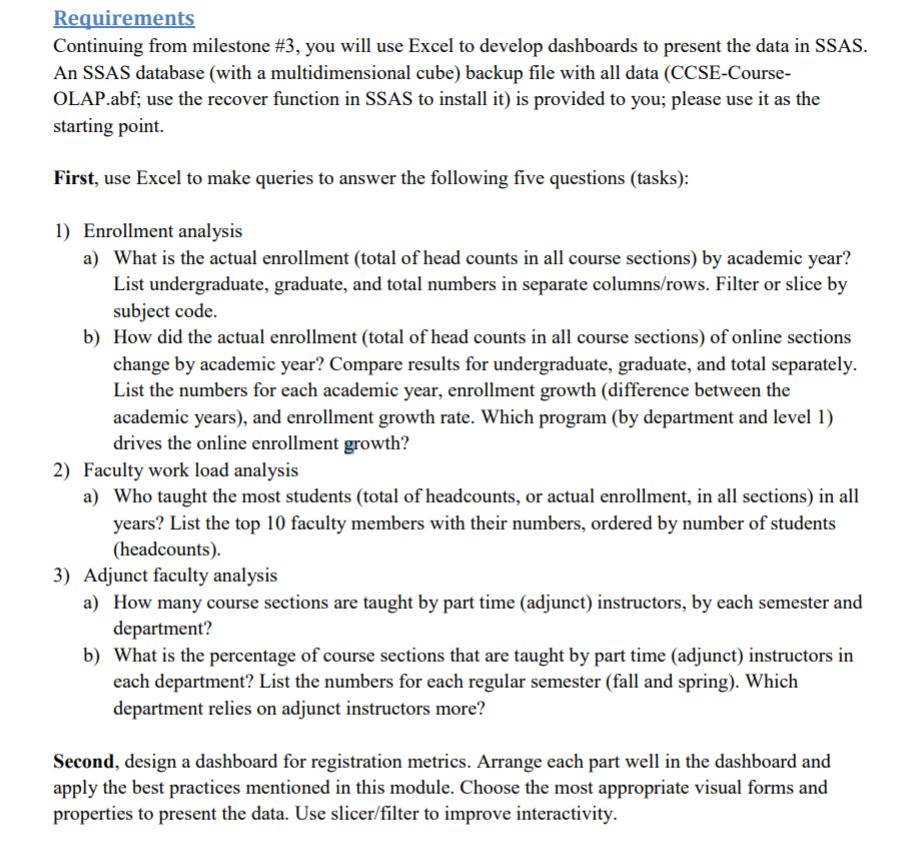
Requirement Continuing from milestone #3, you will use Excel to develop dashboards to present the data in SSAS An SSAS database (with a multidimensional cube) backup file with all data (CCSE-Course OLAP.abf; use the recover function in SSAS to install it) is provided to you; please use it as the starting point First, use Excel to make queries to answer the following five questions (tasks) 1) Enrollment analysis What is the actual enrollment (total of head counts in all course sections) by academic year? List undergraduate, graduate, and total numbers in separate columns/rows. Filter or slice by subject code. a) b) How did the actual enrollment (total of head counts in all course sections) of online sections change by academic year? Compare results for undergraduate, graduate, and total separately. List the numbers for each academic year, enrollment growth (difference between the academic years), and enrollment growth rate. Which program (by department and level 1) drives the online enrollment growth? 2) Faculty work load analysis a) Who taught the most students (total of headcounts, or actual enrollment, in all sections) in all years? List the top 10 faculty members with their numbers, ordered by number of students (headcounts) 3) Adjunct faculty analysis How many course sections are taught by part time (adjunct) instructors, by each semester and department? a) b) What is the percentage of course sections that are taught by part time (adjunct) instructors in each department? List the numbers for each regular semester (fall and spring). Which department relies on adjunct instructors more? Second, design a dashboard for registration metrics. Arrange each part well in the dashboard and apply the best practices mentioned in this module. Choose the most appropriate visual forms and properties to present the data. Use slicer/filter to improve interactivity. Requirement Continuing from milestone #3, you will use Excel to develop dashboards to present the data in SSAS An SSAS database (with a multidimensional cube) backup file with all data (CCSE-Course OLAP.abf; use the recover function in SSAS to install it) is provided to you; please use it as the starting point First, use Excel to make queries to answer the following five questions (tasks) 1) Enrollment analysis What is the actual enrollment (total of head counts in all course sections) by academic year? List undergraduate, graduate, and total numbers in separate columns/rows. Filter or slice by subject code. a) b) How did the actual enrollment (total of head counts in all course sections) of online sections change by academic year? Compare results for undergraduate, graduate, and total separately. List the numbers for each academic year, enrollment growth (difference between the academic years), and enrollment growth rate. Which program (by department and level 1) drives the online enrollment growth? 2) Faculty work load analysis a) Who taught the most students (total of headcounts, or actual enrollment, in all sections) in all years? List the top 10 faculty members with their numbers, ordered by number of students (headcounts) 3) Adjunct faculty analysis How many course sections are taught by part time (adjunct) instructors, by each semester and department? a) b) What is the percentage of course sections that are taught by part time (adjunct) instructors in each department? List the numbers for each regular semester (fall and spring). Which department relies on adjunct instructors more? Second, design a dashboard for registration metrics. Arrange each part well in the dashboard and apply the best practices mentioned in this module. Choose the most appropriate visual forms and properties to present the data. Use slicer/filter to improve interactivity
Step by Step Solution
There are 3 Steps involved in it

Get step-by-step solutions from verified subject matter experts