

Question: Requirements: 1 . Your function should work * * whenever ` m _ rows * m _ cols ` is equal to the total number
Requirements:
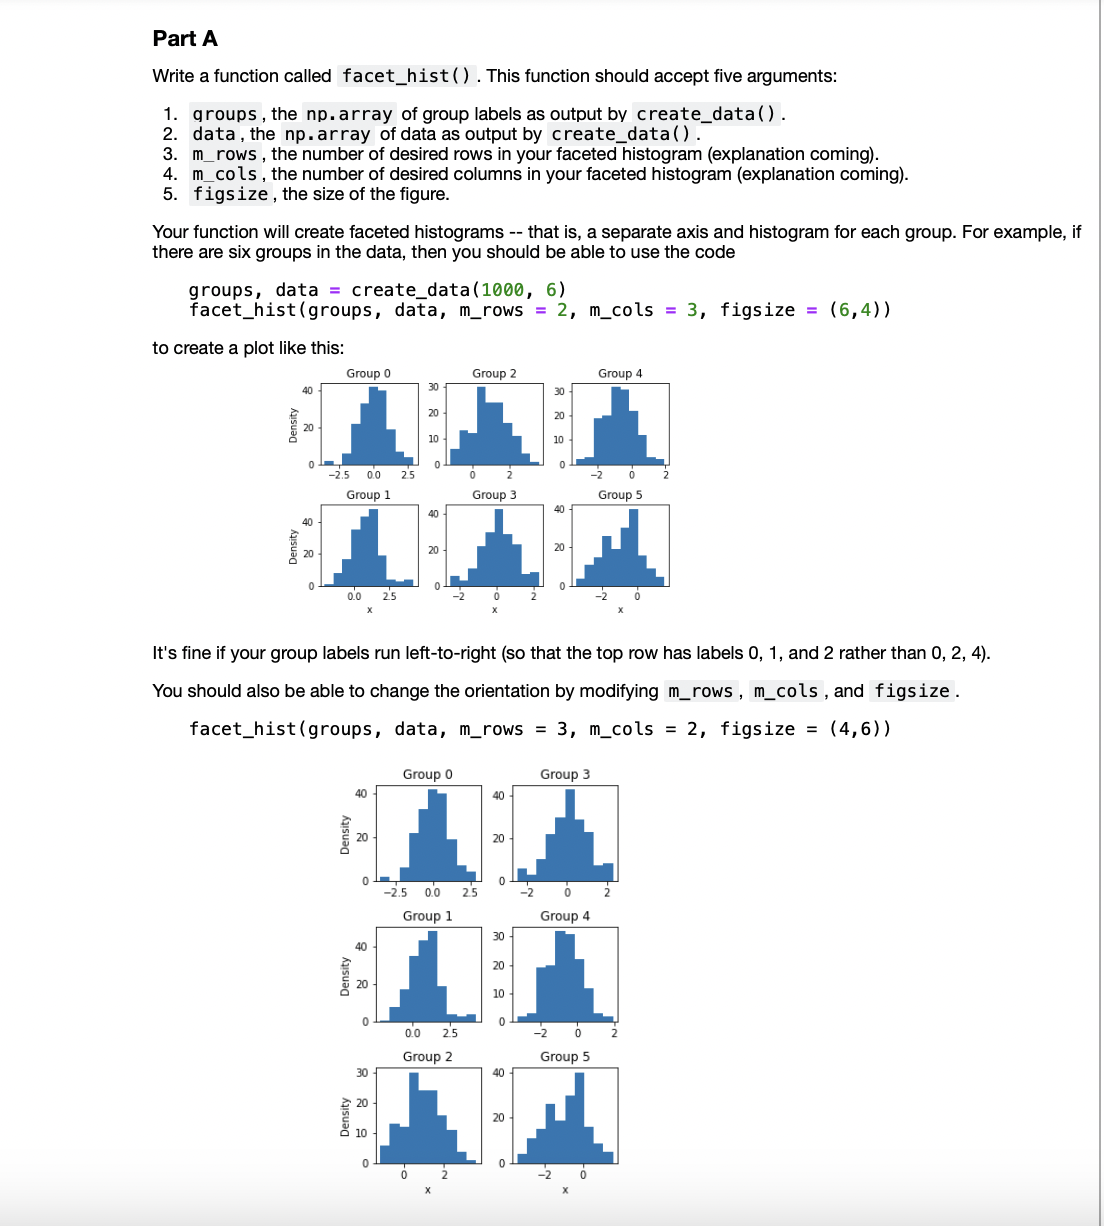
Your function should work whenever mrowsmcols is equal to the total number of groups. Your function should first check that this is the case, and raise an informative ValueError if not. You may assume that there is at least one data point for each group label in the data supplied.
For full credit, you should not loop over the individual entries of groups or data It is acceptable to loop over the distinct values of groups In general, aim to minimize forloops and maximize use of numpy indexing.
Use of pandas is acceptable but unnecessary, and is unlikely to make your solution significantly simpler.
You should include a horizontal axis label of your choice along only the bottom row of axes.
You should include a vertical axis label eg "Frequency" along only the leftmost column of axes.
Each axis should have an axis title of the form "Group X as shown above.
Comments and docstrings!
### Hints
If your plots look "squished," then plttightlayout is sometimes helpful. Just call it after constructing your figure, with no arguments.
Integer division i j and remainders i j are helpful here, although other solutions are also possible.
Step by Step Solution
There are 3 Steps involved in it
1 Expert Approved Answer
Step: 1 Unlock

Question Has Been Solved by an Expert!
Get step-by-step solutions from verified subject matter experts
Step: 2 Unlock
Step: 3 Unlock