

Question: Requirements: 1.Calculate the fixed and variable cost using the high low method. 2.Create a scatter graph use visual fit method to estimate fixed cost. 3.Calculate
Requirements:
1.Calculate the fixed and variable cost using the high low method.
2.Create a scatter graph use visual fit method to estimate fixed cost.
3.Calculate least squares regression in excel. What are your fixed and variable costs? Is the data a good fit?
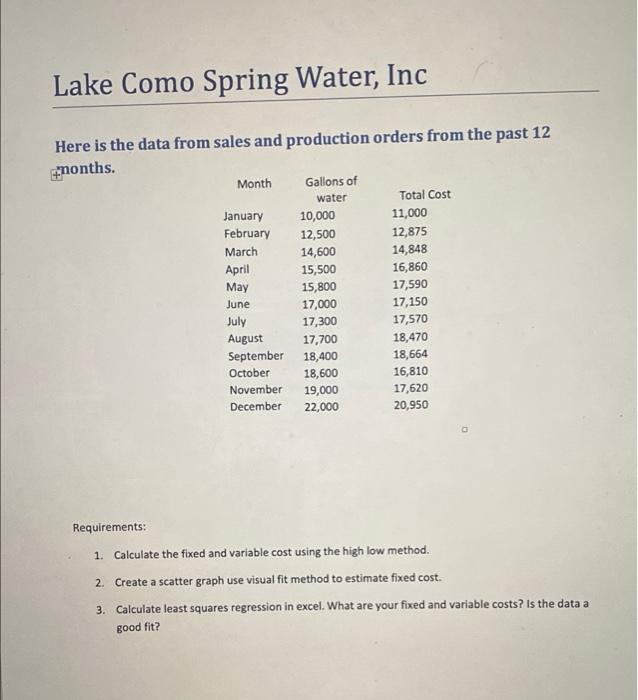
Here is the data from sales and production orders from the past 12 months.
Month
Gallons of water
Total Cost
January
10,000
11,000
February
12,500
12,875
March
14,600
14,848
April
15,500
16,860
May
15,800
17,590
June
17,000
17,150
July
17,300
17,570
August
17,700
18,470
September
18,400
18,664
October
18,600
16,810
November
19,000
17,620
December
22,000
20,950
Here is the data from sales and production orders from the past 12 +nonths. Requirements: 1. Calculate the fixed and variable cost using the high low method. 2. Create a scatter graph use visual fit method to estimate fixed cost. 3. Calculate least squares regression in excel. What are your fixed and variable costs? Is the data a good fit? 50 40 S 1234567.5910111213141 5oles 5
Step by Step Solution
There are 3 Steps involved in it
1 Expert Approved Answer
Step: 1 Unlock

Question Has Been Solved by an Expert!
Get step-by-step solutions from verified subject matter experts
Step: 2 Unlock
Step: 3 Unlock