

Question: Requirements : Q1. complete the income statement Q2 Using these statements, calculate the following performance measures in the table Q3 Identify strengths and weakness of
Requirements :
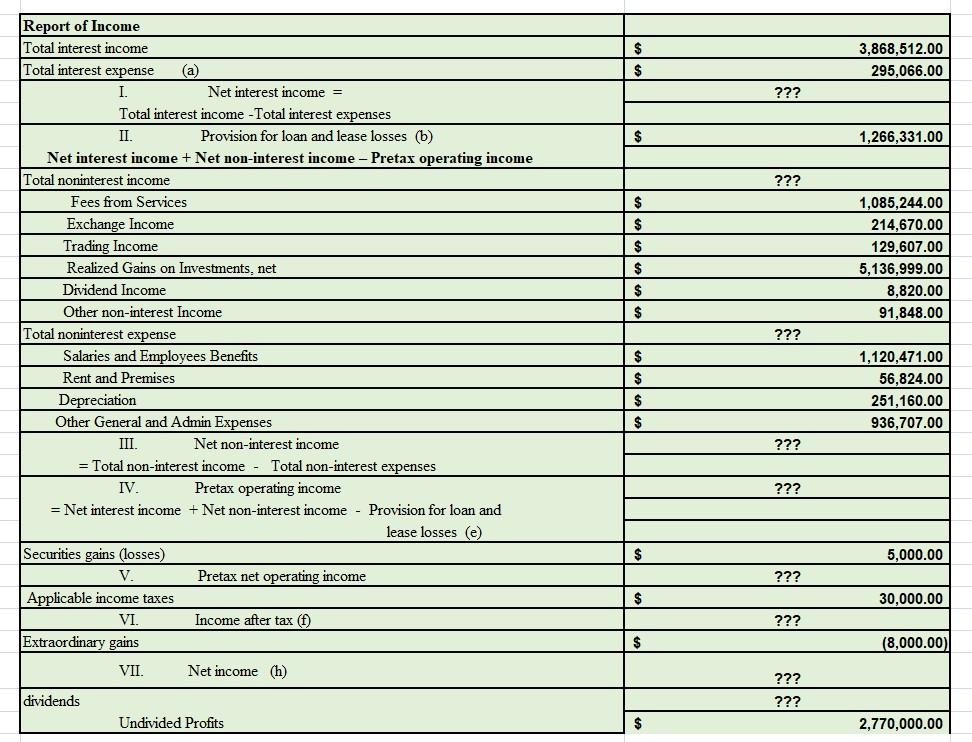
Q1. complete the income statement
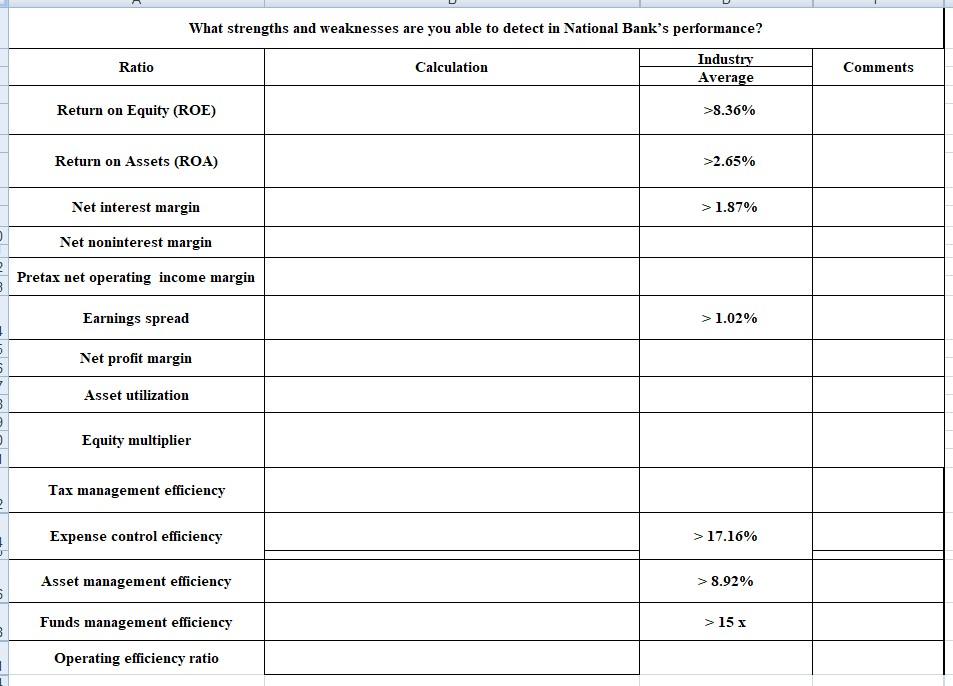
Q2 Using these statements, calculate the following performance measures in the table
Q3 Identify strengths and weakness of the banks
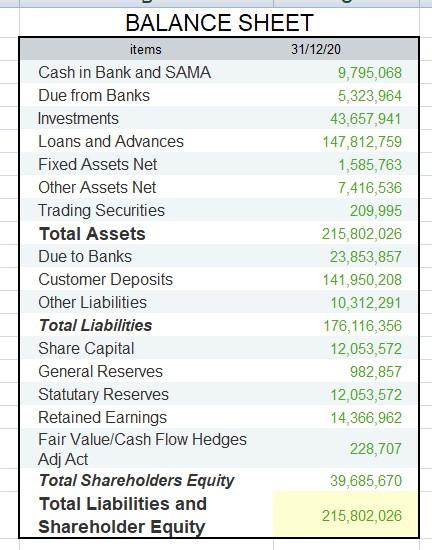
$ $ 3,868,512.00 295,066.00 ??? $ 1,266,331.00 ??? $ $ $ 1,085,244.00 214,670.00 129,607.00 5,136,999.00 8,820.00 91,848.00 $ $ $ Report of Income Total interest income Total interest expense (a) I. Net interest income = Total interest income - Total interest expenses II Provision for loan and lease losses (6) Net interest income + Net non-interest income - Pretax operating income Total noninterest income Fees from Services Exchange Income Trading Income Realized Gains on Investments, net Dividend Income Other non-interest Income Total noninterest expense Salaries and Employees Benefits Rent and Premises Depreciation Other General and Admin Expenses III. Net non-interest income = Total non-interest income - Total non-interest expenses IV. Pretax operating income = Net interest income + Net non-interest income - Provision for loan and lease losses (e) Securities gains (losses) V. Pretax net operating income Applicable income taxes VI. Income after tax (f) Extraordinary gains ??? $ $ $ $ 1,120,471.00 56,824.00 251,160.00 936.707.00 ??? ??? $ 5,000.00 ??? $ 30,000.00 ??? $ (8,000.00) VII Net income (h) ??? ??? dividends Undivided Profits $ 2,770,000.00 What strengths and weaknesses are you able to detect in National Bank's performance? Ratio Calculation Industry Average Comments Return on Equity (ROE) >8.36% Return on Assets (ROA) >2.65% Net interest margin > 1.87% Net noninterest margin Pretax net operating income margin Earnings spread > 1.02% Net profit margin - Asset utilization Equity multiplier Tax management efficiency Expense control efficiency > 17.16% Asset management efficiency > 8.92% Funds management efficiency > 15x Operating efficiency ratio BALANCE SHEET items 31/12/20 Cash in Bank and SAMA 9,795,068 Due from Banks 5,323,964 Investments 43,657,941 Loans and Advances 147,812,759 Fixed Assets Net 1,585,763 Other Assets Net 7,416,536 Trading Securities 209,995 Total Assets 215,802,026 Due to Banks 23,853,857 Customer Deposits 141,950,208 Other Liabilities 10,312,291 Total Liabilities 176,116,356 Share Capital 12,053,572 General Reserves 982,857 Statutary Reserves 12,053,572 Retained Earnings 14,366,962 Fair Value/Cash Flow Hedges 228,707 Adj Act Total Shareholders Equity 39,685,670 Total Liabilities and 215,802,026 Shareholder Equity $ $ 3,868,512.00 295,066.00 ??? $ 1,266,331.00 ??? $ $ $ 1,085,244.00 214,670.00 129,607.00 5,136,999.00 8,820.00 91,848.00 $ $ $ Report of Income Total interest income Total interest expense (a) I. Net interest income = Total interest income - Total interest expenses II Provision for loan and lease losses (6) Net interest income + Net non-interest income - Pretax operating income Total noninterest income Fees from Services Exchange Income Trading Income Realized Gains on Investments, net Dividend Income Other non-interest Income Total noninterest expense Salaries and Employees Benefits Rent and Premises Depreciation Other General and Admin Expenses III. Net non-interest income = Total non-interest income - Total non-interest expenses IV. Pretax operating income = Net interest income + Net non-interest income - Provision for loan and lease losses (e) Securities gains (losses) V. Pretax net operating income Applicable income taxes VI. Income after tax (f) Extraordinary gains ??? $ $ $ $ 1,120,471.00 56,824.00 251,160.00 936.707.00 ??? ??? $ 5,000.00 ??? $ 30,000.00 ??? $ (8,000.00) VII Net income (h) ??? ??? dividends Undivided Profits $ 2,770,000.00 What strengths and weaknesses are you able to detect in National Bank's performance? Ratio Calculation Industry Average Comments Return on Equity (ROE) >8.36% Return on Assets (ROA) >2.65% Net interest margin > 1.87% Net noninterest margin Pretax net operating income margin Earnings spread > 1.02% Net profit margin - Asset utilization Equity multiplier Tax management efficiency Expense control efficiency > 17.16% Asset management efficiency > 8.92% Funds management efficiency > 15x Operating efficiency ratio BALANCE SHEET items 31/12/20 Cash in Bank and SAMA 9,795,068 Due from Banks 5,323,964 Investments 43,657,941 Loans and Advances 147,812,759 Fixed Assets Net 1,585,763 Other Assets Net 7,416,536 Trading Securities 209,995 Total Assets 215,802,026 Due to Banks 23,853,857 Customer Deposits 141,950,208 Other Liabilities 10,312,291 Total Liabilities 176,116,356 Share Capital 12,053,572 General Reserves 982,857 Statutary Reserves 12,053,572 Retained Earnings 14,366,962 Fair Value/Cash Flow Hedges 228,707 Adj Act Total Shareholders Equity 39,685,670 Total Liabilities and 215,802,026 Shareholder Equity
Step by Step Solution
There are 3 Steps involved in it

Get step-by-step solutions from verified subject matter experts