

Question: Research Analysis Assignment 3 for Chapters 8 (Composite Measures) and 10 (Crosstabulation) Instructions: To successfully complete the assignment for Chapters 8 and 10, you will
Research Analysis
Assignment 3 for Chapters 8 (Composite Measures) and 10 (Crosstabulation)
Instructions: To successfully complete the assignment for Chapters 8 and 10, you will need to have watched the recordings for Chapters 8 and 10 on Canvas and watched the videos for Chapters 8 and 10 on the companion website. You are not to do Lab 8.1 or Lab 10.1.
Link to companion site videos: https://study.sagepub.com/babbie10e/student-resources-0/screen-cast-videos
Chapter 8:
- What is a composite measure and why do researchers create them?
- Which SPSS command do you use to create an index (Analyze, Compute, Count, or Recode)?
- After creating an index, why do you need to go to the Variable View tab?
- Can the procedures used to create a composite measure in this chapter be used if the variables are not coded in the same way (Yes or No)?
- Can composite measures (or indices) be based on the scores of more than two variables (Yes or No)?
- For the output findings below from the companion website video, write two or more sentences of written analysis.
- From the video and for the index POLIN (which connected with the use of force by police officers).
- 9.0%:Approve in both cases
- 77.1%:Approve in one case
- 13.9%:Disapprove in both cases
Chapter 10:
- What is bivariate analysis?
- What are the major differences between univariate analysis and bivariate analysis with respect to the following:
- Number of variables analyzed
- Questions asked (which analysis focuses on the question "what" and which analysis focuses on "why")
- The primary goals of the research (which focuses on explaining and which focuses on description)
| Major Differences | Univariate Analysis | Bivariate Analysis |
| Number of variables | ||
| Questions asked | ||
| Primary goals |
- What are three questions you can ask yourself when examining a crosstab with two ordinal variables?
- Identify the independent variable for each of the following:
- Those employed by companies with more than 20 employees are more likely to have some form of health care as compared to those employed by companies with fewer employees.
- In the United States, those who identify as female are more likely to vote Democratic than those who identify as male.
- When running crosstabs, the authors suggest to specify the dependent variable as the row variable (True or False).
- If you produce a crosstab for the variables Religious Affiliation (a nominal variable) and Political Party (a nominal variable with the following categories: Democrat, Independent, Republican, Other), is it possible to determine the direction of association between these two variables (Yes or No)?
- A researcher produces a crosstab for the variables Age (as an ordinal set of categories) and level of happiness (with low, medium, and high) and finds a negative (or indirect) relationship between these two variables. This means that the older someone is the happier they are. (True or False).
- What is epsilon and how is it calculated?
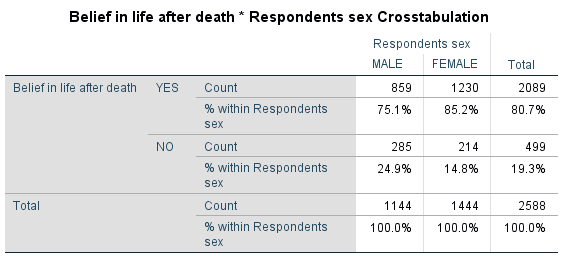
- Provide at least three sentences of written analysis about the table below. Post life connects with whether respondents believe in life after death. As part of your analysis be sure to include whether there is an association between these two variables. That is, are males or females more likely to believe in life after death? Also, include one epsilon.


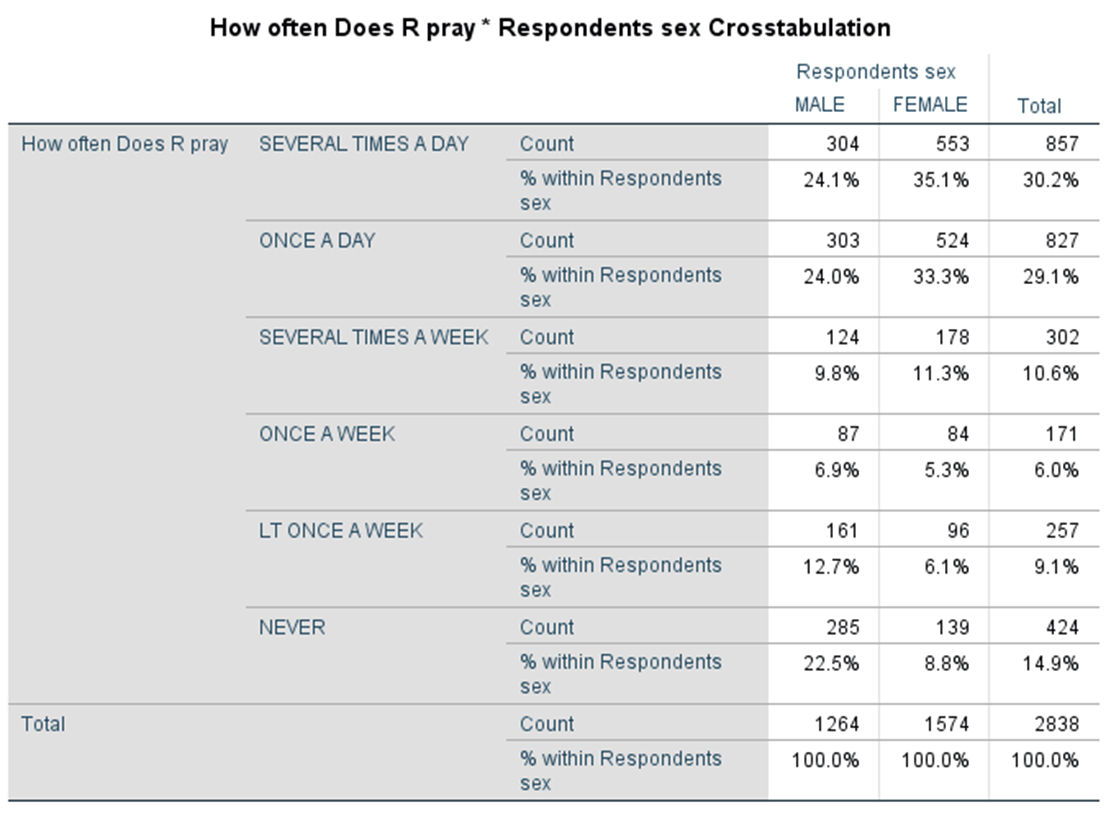
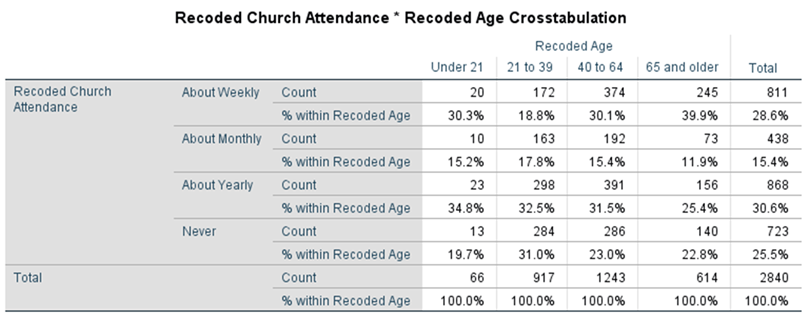
Belief in life after death * Respondents sex Crosstabulation Respondents sex MALE FEMALE Total Belief in life after death YES Count 859 1230 2089 % within Respondents 75.1% 85.2% 80.7% sex NO Count 285 214 499 % within Respondents 24.9% 14.8% 19.3% sex Total Count 1144 1444 2588 % within Respondents 100.0% 100.0% 100.0% sexHow often Does R pray * Respondents sex Crosstabulation Respondents sex MALE FEMALE Total How often Does R pray SEVERAL TIMES A DAY Count 304 553 857 % within Respondents 24.1% 35.1% 30.2% sex ONCE A DAY Count 303 524 827 % within Respondents 24.0% 33.3% 29.1% sex SEVERAL TIMES A WEEK Count 124 178 302 % within Respondents 9.8% 11.3% 10.6% sex ONCE A WEEK Count 87 84 171 % within Respondents 6.9% 5.3% 6.0% sex LT ONCE A WEEK Count 161 96 257 % within Respondents 12.7% 6.1% 9.1% sex NEVER Count 285 139 424 % within Respondents 22.5% 8.8% 14.9% sex Total Count 1264 1574 2838 % within Respondents 100.0% 100.0% 100.0% sexRecoded Church Attendance * Recoded Age Crosstabulation Recoded Age Under 21 21 to 39 40 to 64 65 and older Total Recoded Church About Weekly Count 20 172 374 245 811 Attendance % within Recoded Age 30.3% 18.8% 30.1% 39.9% 28.6% About Monthly Count 10 163 192 73 438 % within Recoded Age 15.2% 17.8% 15.4% 11.9% 15.4% About Yearly Count 23 298 391 156 868 % within Recoded Age 34.8% 32.5% 31.5% 25.4% 30.6% Never Count 13 284 286 140 723 % within Recoded Age 19.7% 31.0% 23.0% 22.8% 25.5% Total Count 66 917 1243 614 2840 % within Recoded Age 100.0% 100.0% 100.0% 100.0% 100.0%
Step by Step Solution
There are 3 Steps involved in it

Get step-by-step solutions from verified subject matter experts