

Question: Research analysis both scatter plots, research should include presents facts, data, and summary statistics to prove the thesis, provide comparison between the two scatter plotsThesis:
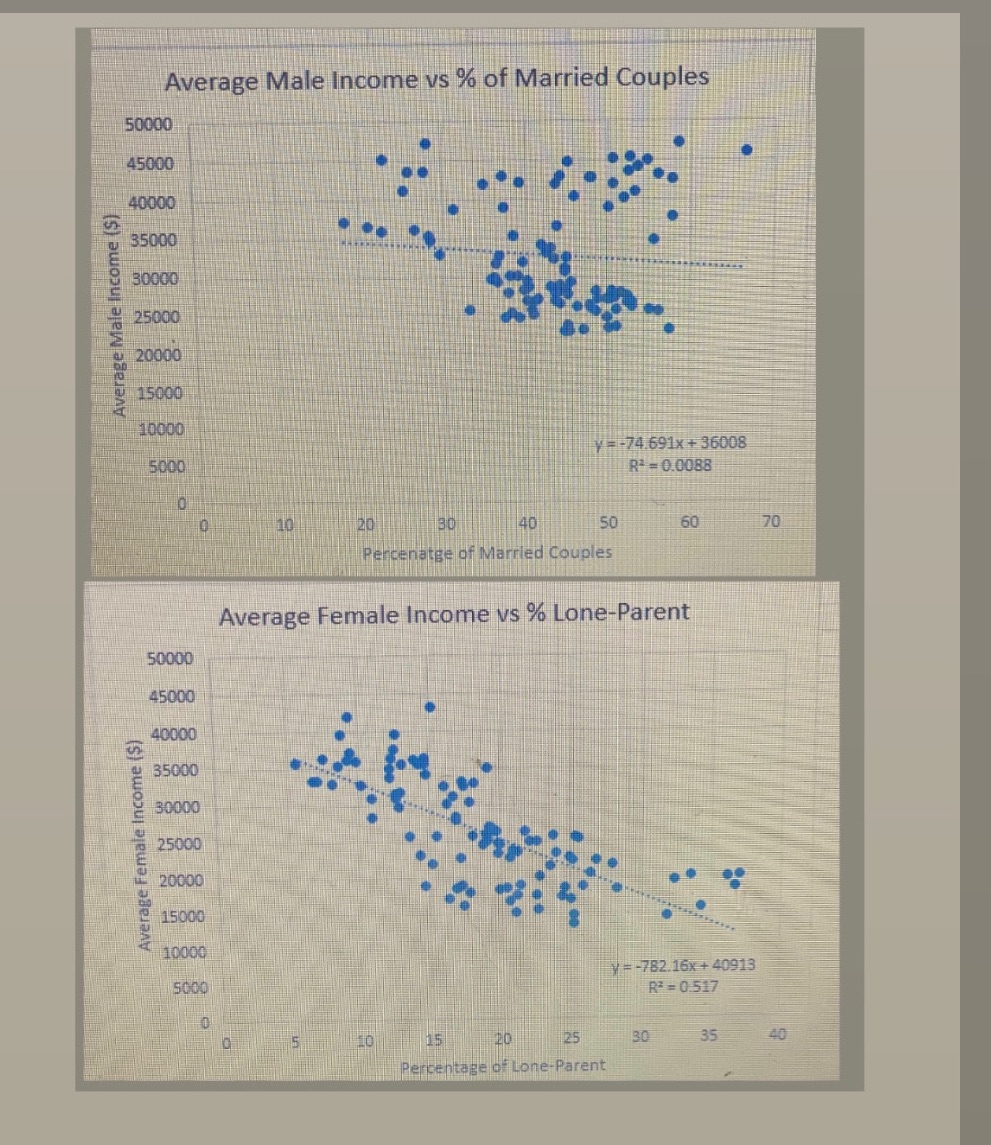
Research analysis both scatter plots, research should include presents facts, data, and summary statistics to prove the thesis, provide comparison between the two scatter plotsThesis: In Toronto Canada, Families Headed by a married couple earn a higher income on average than families headed by lone parents. Also in Toronto Canada men earn a higher income than women. okay
Step by Step Solution
There are 3 Steps involved in it
1 Expert Approved Answer
Step: 1 Unlock

Question Has Been Solved by an Expert!
Get step-by-step solutions from verified subject matter experts
Step: 2 Unlock
Step: 3 Unlock