

Question: Research and development $ 10,000,000 Test marketing cost $ 5,000,000 Initial equipment cost $ 160,000,000 Equipment salvage value $ 65,000,000 Year 1 depreciation 14.30% Year
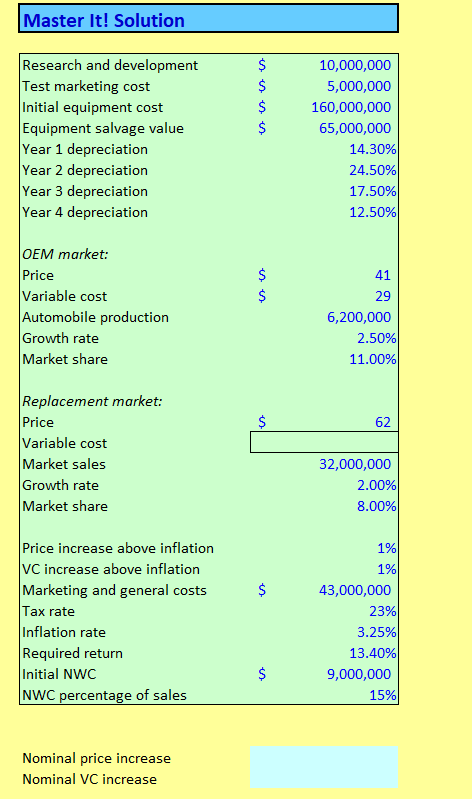
| Research and development | $ 10,000,000 |
| Test marketing cost | $ 5,000,000 |
| Initial equipment cost | $ 160,000,000 |
| Equipment salvage value | $ 65,000,000 |
| Year 1 depreciation | 14.30% |
| Year 2 depreciation | 24.50% |
| Year 3 depreciation | 17.50% |
| Year 4 depreciation | 12.50% |
please ASAP!
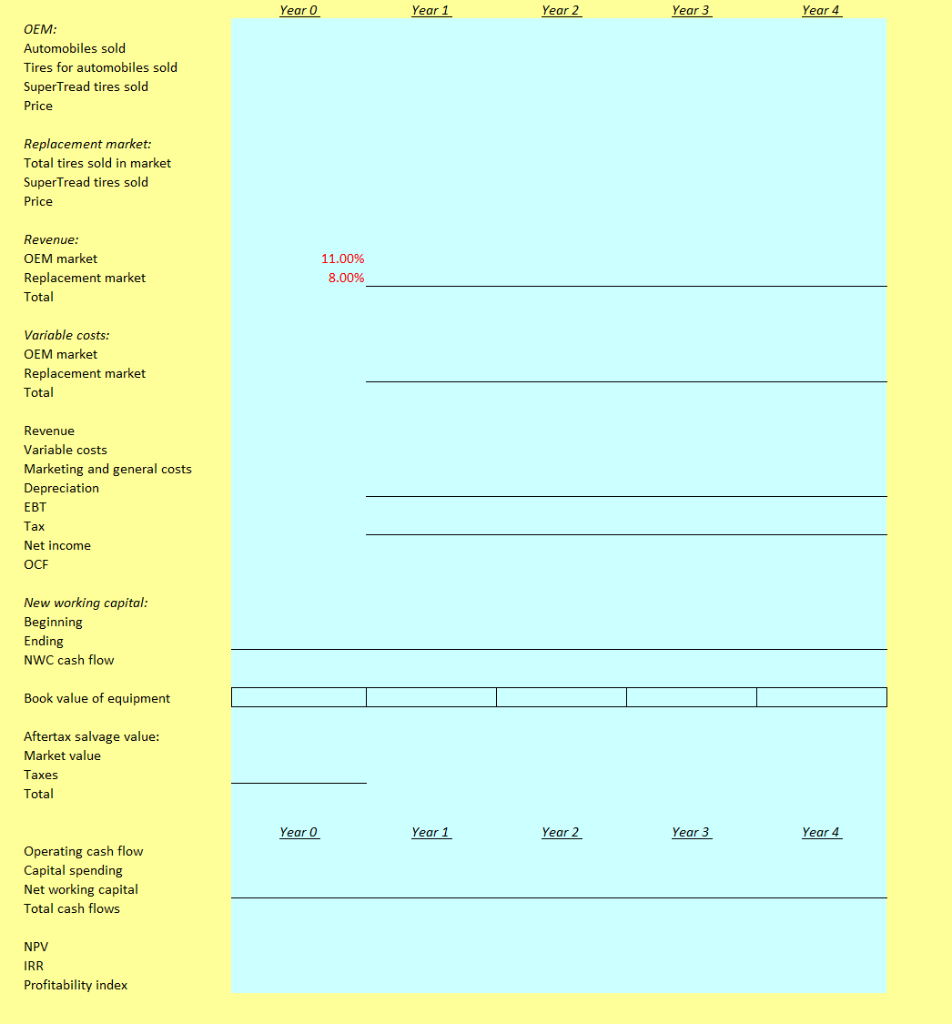
Master It! Solution $ $ $ $ Research and development Test marketing cost Initial equipment cost Equipment salvage value Year 1 depreciation Year 2 depreciation Year 3 depreciation Year 4 depreciation 10,000,000 5,000,000 160,000,000 65,000,000 14.30% 24.50% 17.50% 12.50% $ $ OEM market: Price Variable cost Automobile production Growth rate Market share 41 29 6,200,000 2.50% 11.00% $ 62 Replacement market: Price Variable cost Market sales Growth rate Market share 32,000,000 2.00% 8.00% $ Price increase above inflation VC increase above inflation Marketing and general costs Tax rate Inflation rate Required return Initial NWC NWC percentage of sales 1% 1% 43,000,000 23% 3.25% 13.40% 9,000,000 15% $ Nominal price increase Nominal VC increase Year 0 Year 1 Year 1 Year 2 Year 3 Year 4 OEM: Automobiles sold Tires for automobiles sold SuperTread tires sold Price Replacement market: Total tires sold in market SuperTread tires sold Price Revenue: OEM market Replacement market Total 11.00% 8.00% Variable costs: OEM market Replacement market Total Revenue Variable costs Marketing and general costs Depreciation EBT Tax Net income OCF New working capital: Beginning Ending NWC cash flow Book value of equipment Aftertax salvage value: Market value Taxes Total Year o Year 1 Year 2 Year 3 Year 3 Year 4 Operating cash flow Capital spending Net working capital Total cash flows NPV IRR Profitability index Master It! Solution $ $ $ $ Research and development Test marketing cost Initial equipment cost Equipment salvage value Year 1 depreciation Year 2 depreciation Year 3 depreciation Year 4 depreciation 10,000,000 5,000,000 160,000,000 65,000,000 14.30% 24.50% 17.50% 12.50% $ $ OEM market: Price Variable cost Automobile production Growth rate Market share 41 29 6,200,000 2.50% 11.00% $ 62 Replacement market: Price Variable cost Market sales Growth rate Market share 32,000,000 2.00% 8.00% $ Price increase above inflation VC increase above inflation Marketing and general costs Tax rate Inflation rate Required return Initial NWC NWC percentage of sales 1% 1% 43,000,000 23% 3.25% 13.40% 9,000,000 15% $ Nominal price increase Nominal VC increase Year 0 Year 1 Year 1 Year 2 Year 3 Year 4 OEM: Automobiles sold Tires for automobiles sold SuperTread tires sold Price Replacement market: Total tires sold in market SuperTread tires sold Price Revenue: OEM market Replacement market Total 11.00% 8.00% Variable costs: OEM market Replacement market Total Revenue Variable costs Marketing and general costs Depreciation EBT Tax Net income OCF New working capital: Beginning Ending NWC cash flow Book value of equipment Aftertax salvage value: Market value Taxes Total Year o Year 1 Year 2 Year 3 Year 3 Year 4 Operating cash flow Capital spending Net working capital Total cash flows NPV IRR Profitability index
Step by Step Solution
There are 3 Steps involved in it

Get step-by-step solutions from verified subject matter experts