

Question: solve theMarket Values ratios and the DuPont analysis 2016 and 2017 and then write the interpretation per ratio of the Apple Inc. Net sales Cost
solve the Market Values ratios and the DuPont analysis 2016 and 2017 and then write the interpretation per ratio of the Apple Inc.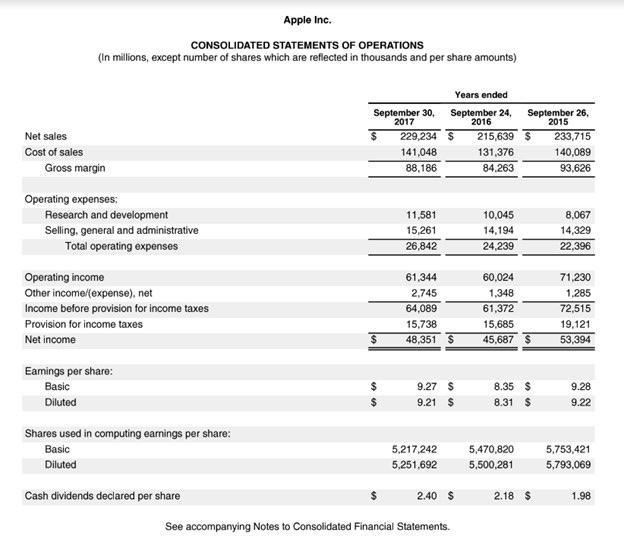
Net sales Cost of sales Apple Inc. CONSOLIDATED STATEMENTS OF OPERATIONS (In millions, except number of shares which are reflected in thousands and per share amounts) Gross margin Operating expenses: Research and development Selling, general and administrative Total operating expenses Operating income Other income/(expense), net Income before provision for income taxes Provision for income taxes Net income Earings per share: Basic Diluted Shares used in computing earnings per share: Basic Diluted Cash dividends declared per share September 30, 2017 $ 229,234 $ 141,048 88,186 11,581 15,261 26,842 Years ended September 24, 2016 61,344 2,745 64,089 15,738 48,351 $ 9.27 $ 9.21 $ 5,217,242 5,251,692 2.40 $ See accompanying Notes to Consolidated Financial Statements. 215,639 $ 131,376 84.263 10,045 14,194 24,239 60,024 1,348 September 26, 2015 61,372 15,685 45,687 $ 8.35 $ 8.31 $ 5,470,820 5,500,281 2.18 $ 233,715 140,089 93,626 8,067 14,329 22,396 71,230 1,285 72,515 19,121 53,394 9.28 9.22 5,753,421 5,793,069 1.98
Step by Step Solution
3.41 Rating (148 Votes )
There are 3 Steps involved in it
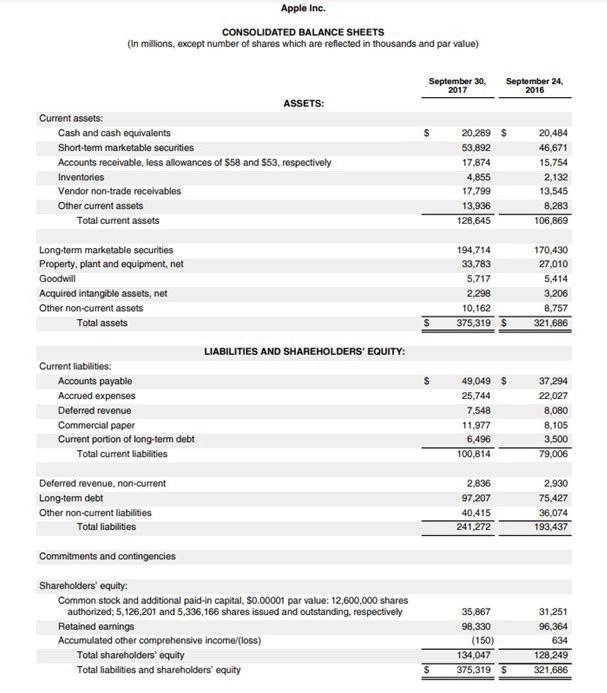
To perform a DuPont analysis and calculate market value ratios for Apple Inc for the years 2016 and 2017 well need to use key financial figures from the income statement and balance sheet provided Let... View full answer

Get step-by-step solutions from verified subject matter experts