

Question: Results An experimental result for a quantity always includes 3 components: a best estimate, the total uncertainty of that estimate, and the 95% credible interval
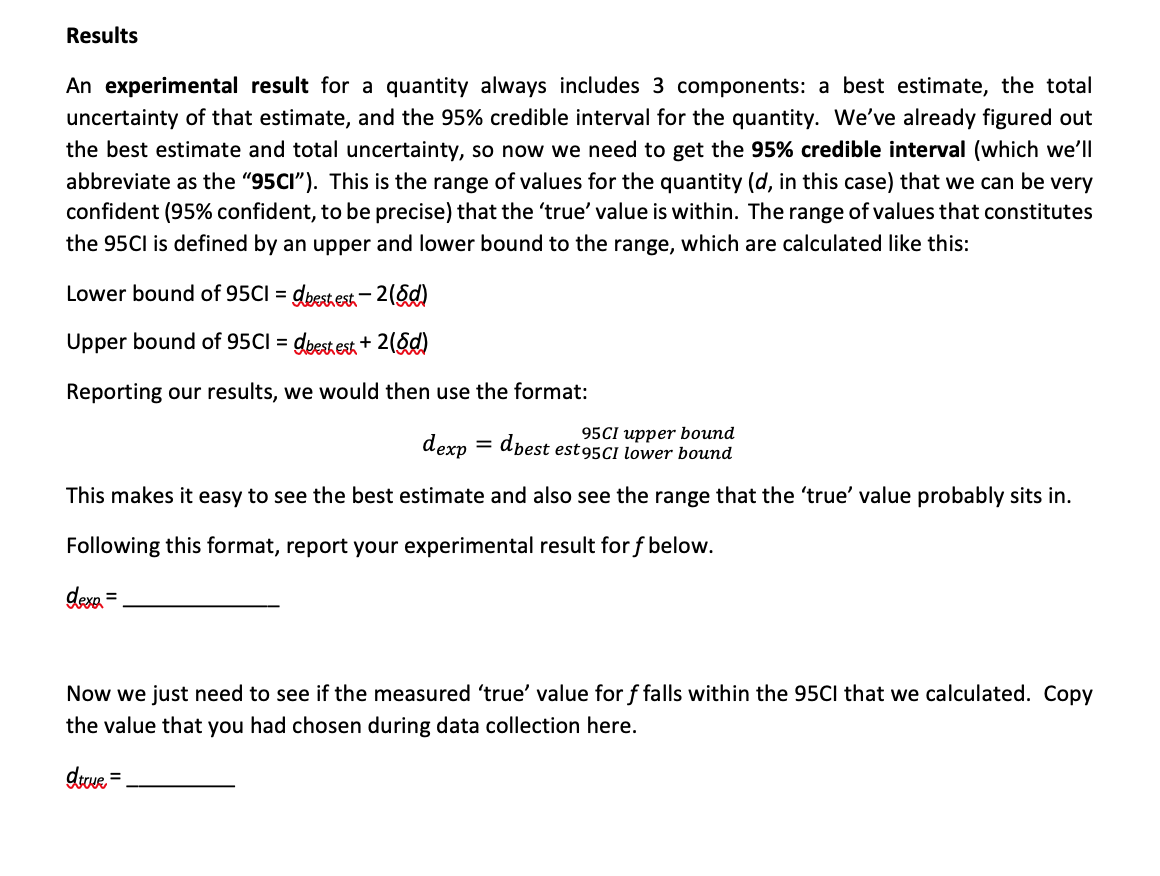
Results An experimental result for a quantity always includes 3 components: a best estimate, the total uncertainty of that estimate, and the 95% credible interval for the quantity. We've already figured out the best estimate and total uncertainty, so now we need to get the 95% credible interval (which we'll abbreviate as the "950\"). This is the range of values for the quantity (0', in this case) that we can be very confident (95% confident, to be precise} that the 'true' value is within. The range of values that constitutes the 95C| is defined by an upper and lower bound to the range, which are calculated like this: Lower bound of 95C| = Mw 2mm Upper bound of 95C| = mw+ mm Reporting our results, we would then use the format: (1 _ [1 95C! upper bound EXP best estssclY lower bound This makes it easy to see the best estimate and also see the range that the 'true' value probably sits in. Following this format, report your experimental result for f below. am: Now we just need to see if the measured 'true' value forffalls within the 95C| that we calculated. Copy the value that you had chosen during data collection here. draf
Step by Step Solution
There are 3 Steps involved in it

Get step-by-step solutions from verified subject matter experts