

RESULTS REPORTING Introduction to reporting results including your dimension name and SERVQUAL definition, and the three attributes
Question:
RESULTS REPORTING
- Introduction to reporting results including your dimension name and SERVQUAL definition, and the three attributes within you dimension.
HYPOTHESIS TESTING (3/4 – 1 page, 3%)
We will be testing a number of hypotheses in the sections below. Rather than having to repeat the concept in each section, it is often simpler to provide a summary of your testing criteria and approach in one place. This section should include
- What do we mean by statistical hypothesis testing?
- Discuss the concept of the null and alternative hypotheses
- Identify/define the critical alpha value used as a judgment criteria for decision-making
- Discuss how the critical alpha value is used in determining the test results.
OVERALL SATISFACTION (½ page without tables/graphs, 3%)
Since this section of the report will describe the results of the components that influence overall satisfaction (dimensions and satisfaction attributes of dimension), it makes sense to present the results of the overall satisfaction question first. This section should include the following:
- Introduction including why overall satisfaction was asked before the satisfaction attribute questions
- Explain the scale being used (note in your discussion that it will be the same for all satisfaction questions to avoid repeating)
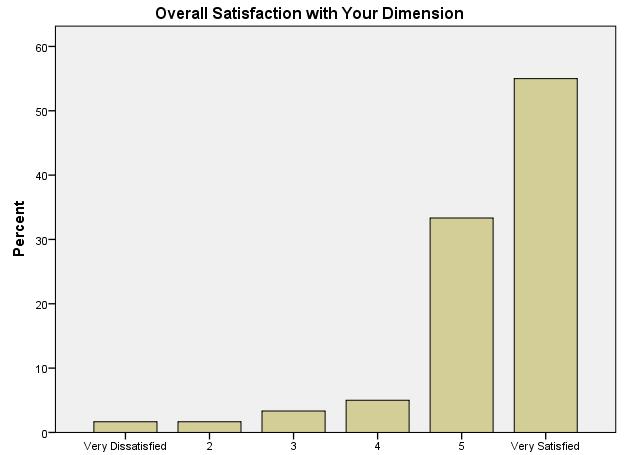
- Include the percentage distribution graph (example below) & explain 68% of the distribution using conceptualizations
- Report the mean
Overall Satisfaction with Bella Milano’s |
DIMENSION DESCRIPTIVE RESULTS: (1 - 2 pages -without tables/graphs, 28%)
Since each dimension is made up of several attributes, it makes sense to provide a measure of overall satisfaction with your dimension. This will be a calculated value. This section should include:
- Explain of how the overall dimension satisfaction was calculated
- Include a percentage distribution graph for overall dimension satisfaction (example below)
- Discuss 68% of the distribution using conceptualizations
- Report the mean
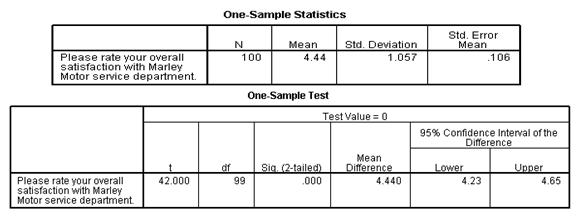
Population Parameter Estimate on Overall Dimension
- What is a population parameter
- Why population parameter estimation uses confidence intervals
- Report results using the confidence interval and confidence level
Satisfaction Attributes Descriptive Results
Next, you will want to report the results of the three satisfaction attributes (questions) included within your dimension in rank order with the highest mean rating first. For each attribute,:
- Write a sentence or two discussing the importance of the question to the customer (put the question into context). You must use & cite your external sources (10/6 Assignment).
- Include a percentage distribution graph for each question (example below).
- Explain 68% of the distribution using conceptualizations and report the mean.
Example: Automotive repair is a complex process and not easily understood by most customers. The staff’s ability to answer questions demonstrates knowledge and instills a sense of confidence and trust in the staff’s ability (Source). More than one-half of the respondents (54.2%) were very satisfied with the staff’s ability to answer questions. An additional one-third of the respondents (33.5%) rated their satisfaction as a “5” (6 very satisfied). On average, respondents rated the staff’s ability to answer questions as 5.3. |

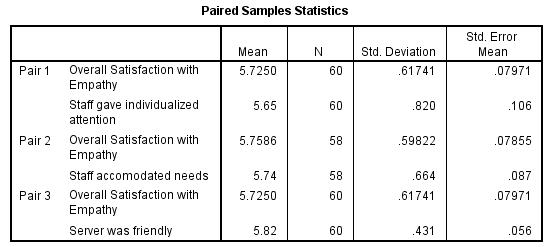
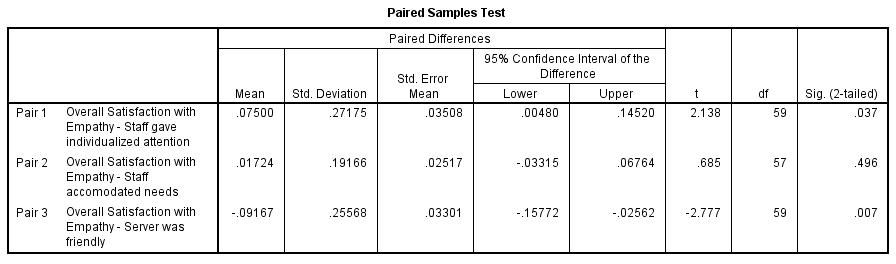
Paired t-test - Attribute Influence on Your Dimension (Extra Credit 5%)
- Run a paired t-test between your dimension and the three satisfaction attributes of your dimension.
- Discuss the purpose of the test (null hypothesis)
- Report the results of the test.
- Discuss the meaning of the paired t-test (value/importance to client)
ESTABLISHING IMPROVEMENT PRIORITIES (1-2 pages without tables/graph, 23%)
Discuss the performance improvement planner (PIP) for your dimension. This section of the report requires you to:
- Introduce the setting priorities section why it is important to set priorities, what is being mapped, the correlation coefficient as derived importance, and the use of the median values as midpoints to establish relative differences.
- Discuss the purpose of the correlation test (null hypothesis) & discuss the results of the tests
- Identify the position of the data in parentheses (mean, correlation coefficient & calculated significance levels or P-values).
- Identify the quadrant name in which each attribute’s falls and discuss its relative position (satisfaction and importance)
- Identify the most important priority for your dimension (What should the client address first)
The graph should include:
- Include the mean, correlation coefficient & calculated significance levels (P-values) on the graph in parentheses.
- Identify relationships that are “significant” and “not significant” (circle or star)
- Classify the strength of the relationships for each attribute below the graph

Priorities Implications (EXCLUDED)
SEGMENTATION (Individual 2 - 3 pages without tables/graphs, 33%)
The purpose of this section is to determine if different expectation segments of the population require special treatment. We will use the measures developed in the expectation section of your questionnaire as the basis for our segmentation. You should begin by briefly discussing the SERVQUAL theory of segmentation.
Independent t-test Theory
- Introduce the Independent t-test and identify the two tests required
- Discuss the purpose of Levene’s test (null hypothesis) & why you must run this test before you run the t-test of equality of means
Independent t-test Results
- Identify the expectation segmentation variable being used, discuss why you believe satisfaction in general will differ by this variable (this will come from SERVQUAL theory), and report the percentage distribution for this variable.
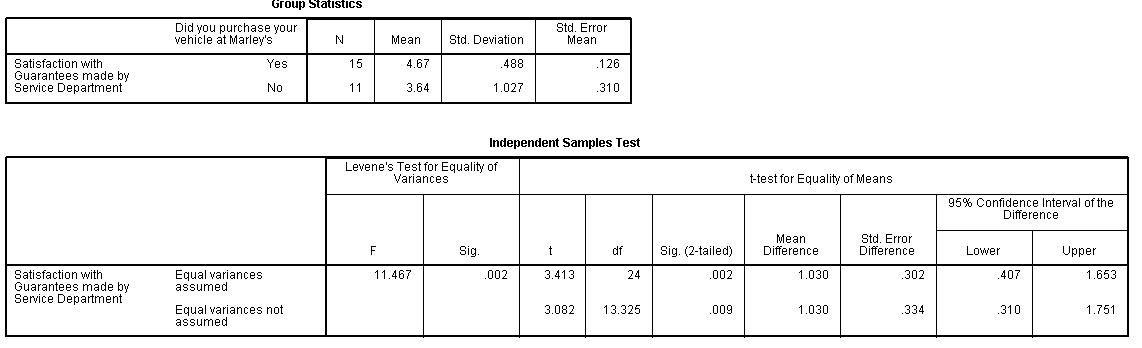
- Run the independent t-test for the satisfaction attribute in your dimension that you identified as the most important priority (PIP section) and discuss the purpose of the t-test for equality of means (null hypothesis).
- Report the results of the t-test, including the significance levels used for both Levene’s test and the t-test for equality of means.
- Explain the value or importance of your results (t-test) to the client
- Include the SPSS output below (Group statistics and Independent samples t-test)
Independent t-test Implications (EXCLUDED)
Analysis of Variance (ANOVA)
- Identify the segmentation variable being used, discuss why you believe satisfaction in general will differ by this variable (will come from SERVQUAL theory), and report the percentage distribution for this variable.
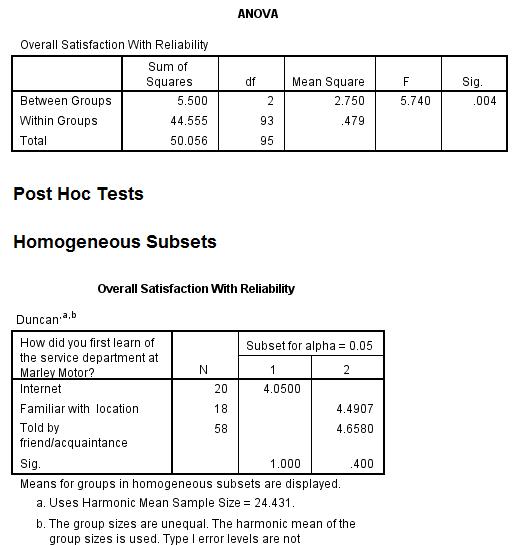
- Run one ANOVA using satisfaction attribute in your dimension that you identified as the most important priority (PIP section) as the dependent variable and discuss the purpose of the ANOVA (null hypothesis).
- Discuss the results of the ANOVA and explain the value or importance of your results to the client.
- Include the SPSS output below (Overall satisfaction and Post Hoc Test if required)
Satisfaction with Guarantees made by Service Department |
Satisfaction with Guarantees made by Service Department |
ANOVA Implications (EXCLUDED)
IMPLICATIONS ADDED (10%)
This section of the report is included so that each student can demonstrate his or her ability to identify and explain the key findings within their section that are important in solving the marketing problem. It should focus on their key priority from the PIP and should not include recommendations for improvement.
- Considering all of the information gathered (client interview, secondary research, etc.), what have you learned that either supports or does not support your findings.
- What expectation management or service process might influence or improve it (Just identify and do not make recommendations)
Expert Answer:
Chapter 1 Introduction Delegates accept a key part in the accomplishment of an affiliation and are the most basic asset an association can have The hugeness of delegates is a for the most part new tho... View the full answer


Modern Database Management
ISBN: 978-0133544619
12th edition
Authors: Jeff Hoffer, Ramesh Venkataraman, Heikki Topi
