

Question: & Return 2 Characteristic Line and Security Market Line You are given the following set of data: HISTORICAL RATES OF RETURN Year NYSE Stock X
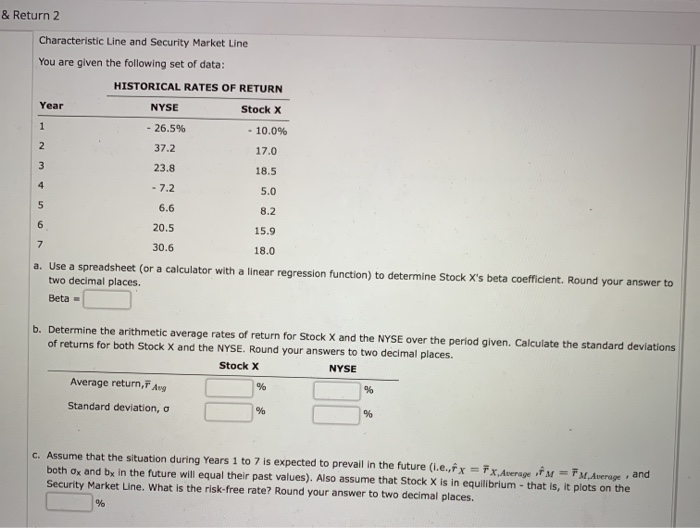
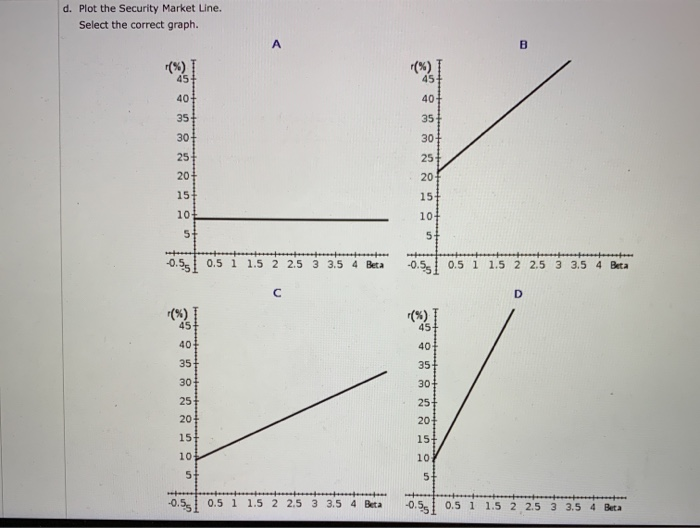
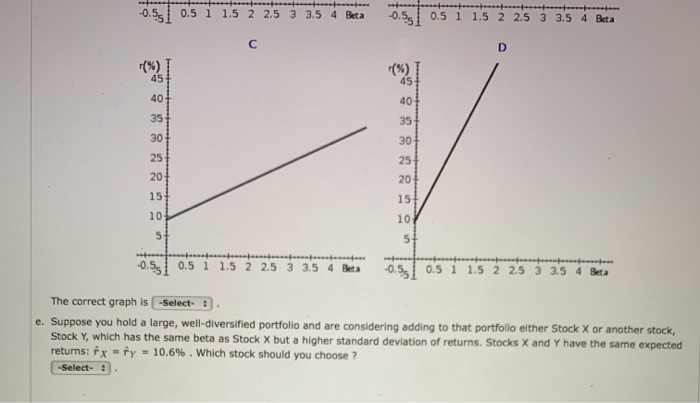
& Return 2 Characteristic Line and Security Market Line You are given the following set of data: HISTORICAL RATES OF RETURN Year NYSE Stock X 1 - 26.5% - 10.0% 2 37.2 17.0 3 23.8 18.5 5.0 - 7.2 6.6 5 8.2 6 20.5 15.9 7 30.6 18.0 a. Use a spreadsheet (or a calculator with a linear regression function) to determine Stock X's beta coefficient. Round your answer to two decimal places. Beta - b. Determine the arithmetic average rates of return for Stock X and the NYSE over the period given. Calculate the standard deviations of returns for both Stock X and the NYSE. Round your answers to two decimal places. Stock X NYSE Average return, Ang % % Standard deviation, o % % c. Assume that the situation during Years 1 to 7 is expected to prevail in the future (1.e.,f x = 7x Average of M = F M Average, and both Ox and by in the future will equal their past values). Also assume that Stock X is in equilibrium - that is, it plots on the Security Market Line. What is the risk-free rate? Round your answer to two decimal places. % d. Plot the Security Market Line. Select the correct graph. A B (%) 45 45 40 40 35 35 30 30 25 25+ 20 20+ 15 15 10 104 5+ 5 -0.5 0.5 i 1.5 2 2.5 3 3.5 4 Beta -0.5 0.5 i 1.5 2 2.5 3 3.5 4 Beta D (%) 45 (%) 1 45 40 35 35 30 u o 8 a 8 8 25 20 15 15+ 10 5 -0.51 0.5 1 1.5 2 2.5 3 3.5 4 Beta -0.55 0.5 1 1.5 2 2.5 3 3.5 4 Beta -0.51 0.5 i 1.5 2 2.5 3 3.5 4 Beta -0.51 0.5 1 1.5 2 2.5 3 3.5 4 Beta D (%) T 45 (%) 40 35 8 8 8 40+ 35 30 25 20 15 25 20 15+ 10 10 5+ 5+ -0.5, 0.5 1 1.5 2 2.5 3 3.5 4 Beta -0.5 0.5 i 1.5 2 2.5 3 3.5 4 Beta The correct graph is -Select- e. Suppose you hold a large, well-diversified portfolio and are considering adding to that portfolio either Stock X or another stock, Stock Y, which has the same beta as Stock x but a higher standard deviation of returns. Stocks X and Y have the same expected returns: fx = fy - 10.6%. Which stock should you choose ? -Select
Step by Step Solution
There are 3 Steps involved in it

Get step-by-step solutions from verified subject matter experts