

Question: Return on Investment, Margin, Turnover Data follow for the Consumer Products Division of Kisler Inc. Year 1 Year 2 $92,100,000$98,750,000 7,900,000 Average operating assets 307,000,000
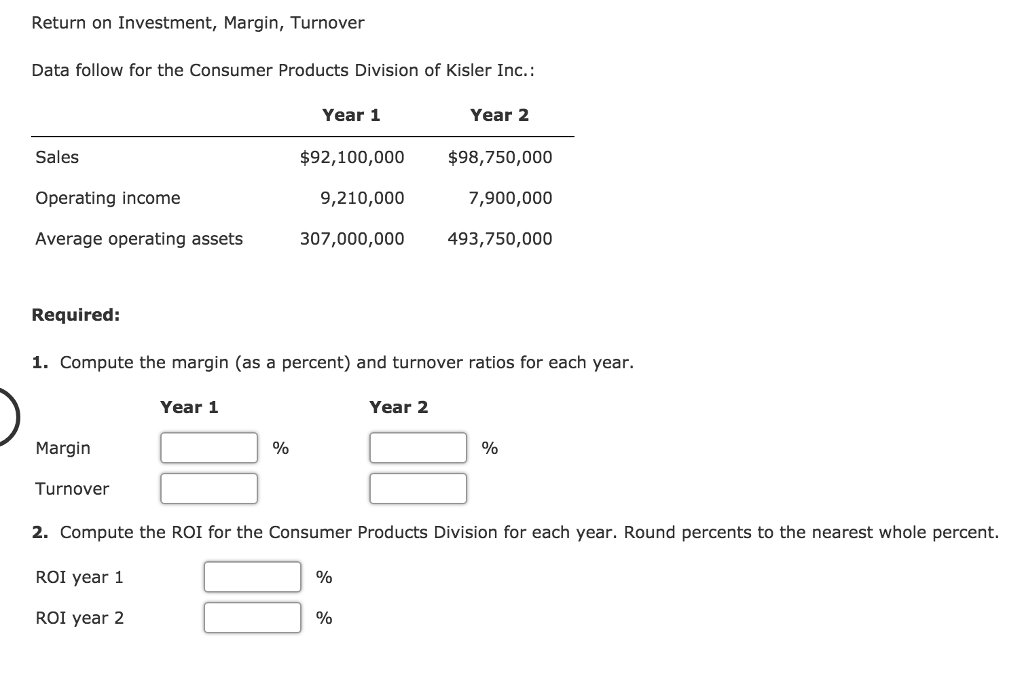
Return on Investment, Margin, Turnover Data follow for the Consumer Products Division of Kisler Inc. Year 1 Year 2 $92,100,000$98,750,000 7,900,000 Average operating assets 307,000,000 493,750,000 Sales Operating income 9,210,000 7 Required: 1. Compute the margin (as a percent) and turnover ratios for each year. Year 1 Year 2 Margin Turnover 2. Compute the ROI for the Consumer Products Division for each year. Round percents to the nearest whole percent ROI year 1 ROI year 2
Step by Step Solution
There are 3 Steps involved in it
1 Expert Approved Answer
Step: 1 Unlock

Question Has Been Solved by an Expert!
Get step-by-step solutions from verified subject matter experts
Step: 2 Unlock
Step: 3 Unlock