

Question: Returns over a given time period are called realized returns. Historical data on realized returns is often used to estimate future results Analysts across companies
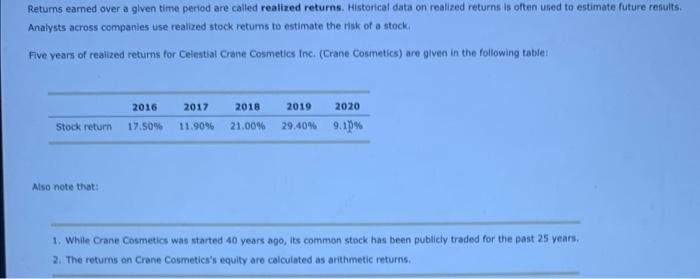
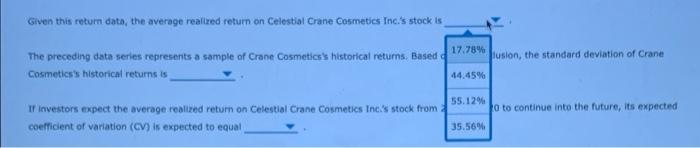
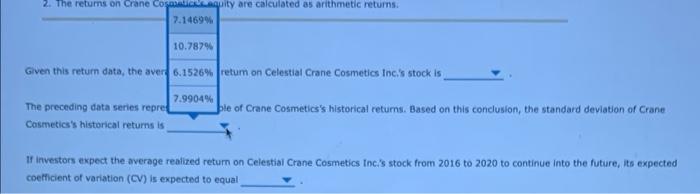
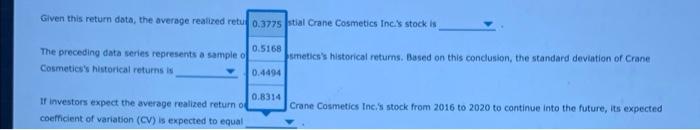
Retums eamed over a given time period are called realized returns. Historical data on realized returns is often used to estimate future results. Analysts across companies use realized stock retums to estimate the risk of a stock Five years of realized returns for Celestial Crane Cosmetics Inc. (Crane Cosmetics) are given in the following table! 2016 2017 2019 2020 2018 21.00% Stock return 17.50% 11.90% 29.40% 9.18% Also note that: 1. While Crane Cosmetics was started 40 years ago, its common stock has been publicly traded for the past 25 years. 2. The returns on Crane Cosmetics's equity are calculated as arithmetic returns Given this return data, the average realized return on Celestial Crane Cosmetics Inc.'s stock is 17.78% lusion, the standard deviation of Crane The preceding data series represents a sample of Crane Cosmetics's historical retums. Based Cosmetics's historical returns is 44.45% If investors expect the average realized return on Celestial Crane Cosmetics Inc.'s stock from coefficient of variation (CV) is expected to equal 55.12% o to continue into the future, its expected 35.56% 2. The returns on Crane Cosequity are calculated as arithmetic returns. 7.1469% 10.7879 Given this return data, the aver 6.1526% fretum on Celestial Crane Cosmetics Inc.'s stock is 7.9904% The preceding data series repre ble of Crane Cosmetics's historical retums. Based on this conclusion, the standard deviation of Crane Cosmetics's historical returns is I investors expect the average realized return on Celestial Crane Cosmetics Inc.'s stock from 2016 to 2020 to continue into the future, its expected coefficient of variation (CV) is expected to equal Given this return data, the average realized retur 0.3775stal Crane Cosmetics Inc.'s stock is The preceding data series represents a sample o 0.5168 umetics's historical returns. Based on this conclusion, the standard deviation of Crane Cosmetics's historical returns is 0.4494 0.8314 If investors expect the average realized return of Crane Cosmetics Inc.'s stock from 2016 to 2020 to continue into the future, its expected coefficient of variation (CV) is expected to equal
Step by Step Solution
There are 3 Steps involved in it

Get step-by-step solutions from verified subject matter experts