

Question: revenue management Data Analytics Problems Problem 1 hotel and an urban hotel. Occupancy Percentage by Day Location Sun Mon Tue Urban 50.3 71.4 79.5 Suburban

revenue management
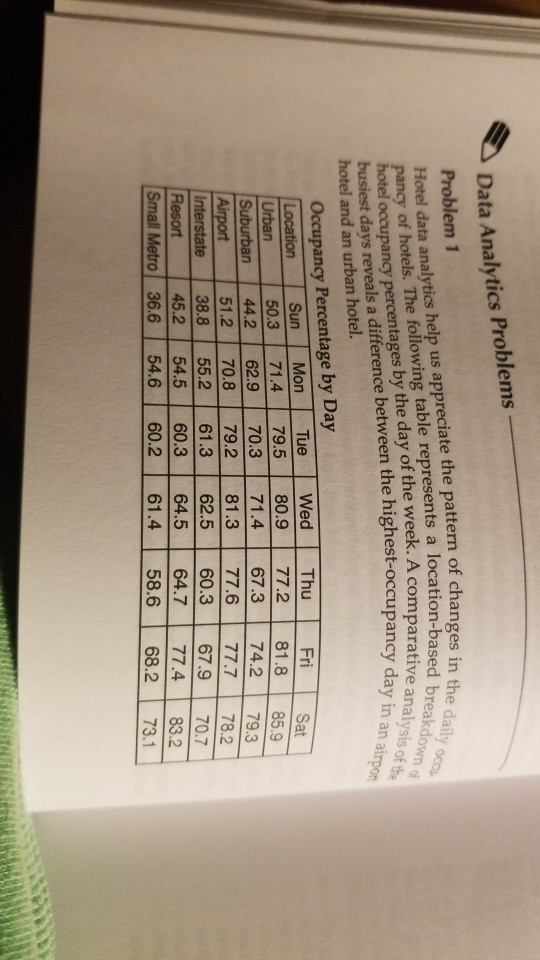
Data Analytics Problems Problem 1 hotel and an urban hotel. Occupancy Percentage by Day Location Sun Mon Tue Urban 50.3 71.4 79.5 Suburban 44.2 62.9 70.3 Airport 51.2 70.8 79.2 Interstate 38.8 55.2 61.3 Resort 45.2 54.5 60.3 Small Metro 36.6 54.6 60.2 Wed 80.9 71.4 81.3 62.5 64.5 61.4 Thu 77.2 67.3 77.6 60.3 64.7 58.6 Fri 81.8 74.2 77.7 67.9 77.4 68.2 Sat 85.9 79.3 78.2 70.7 83.2 73.1 Hotel data analytics help us appreciate the pattern of changes in the daily pancy of hotels. The following table represents a location-based breakdown of busiest days reveals a difference between the highest-occupancy day in an airport hotel occupancy percentages by the day of the week. A comparative analysis of the Internal Measurement Metrics 33 Discussion Questions 1. Which day of the week is the busiest for the airport property? the urban prop- erty? Are they the same? 2. What management decisions will the data analysis affect
Step by Step Solution
There are 3 Steps involved in it

Get step-by-step solutions from verified subject matter experts