

Revenues: Bakery-cafe sales, net Franchise royalties and fees Fresh dough and other product sales to franchisees...
Fantastic news! We've Found the answer you've been seeking!
Question:
Transcribed Image Text:
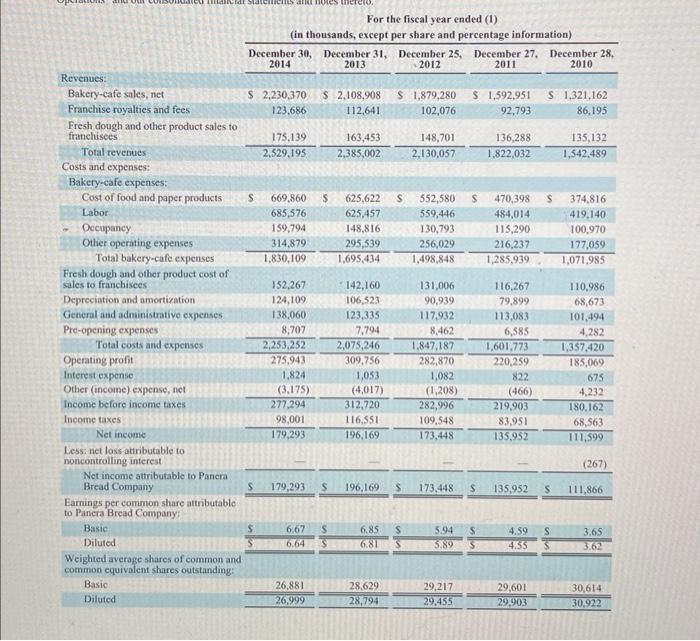
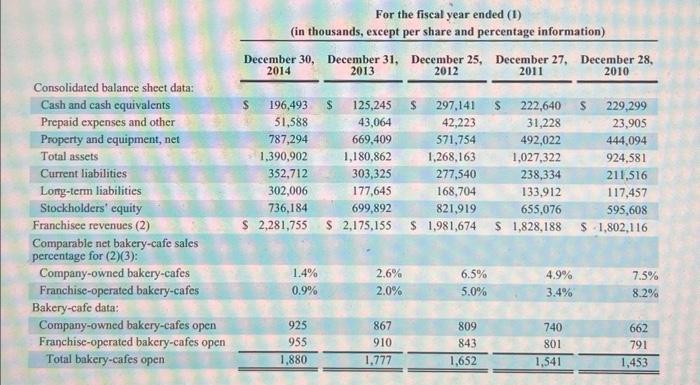
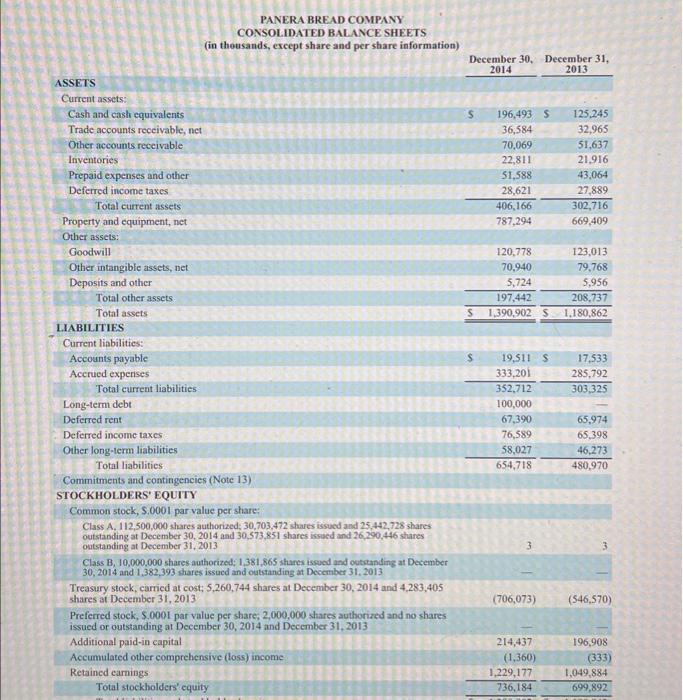
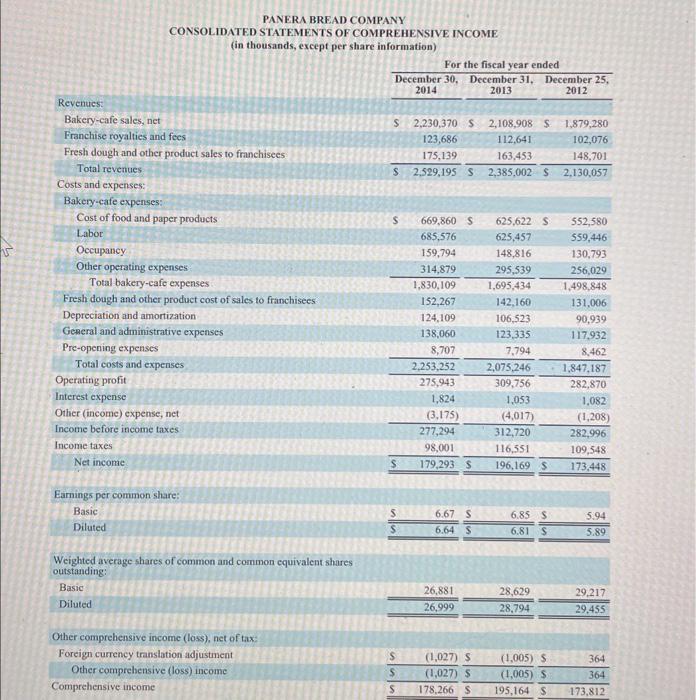
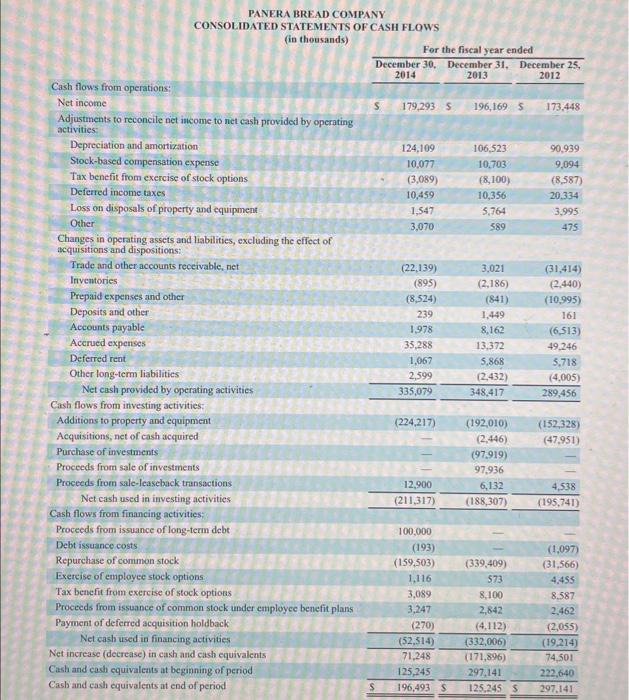
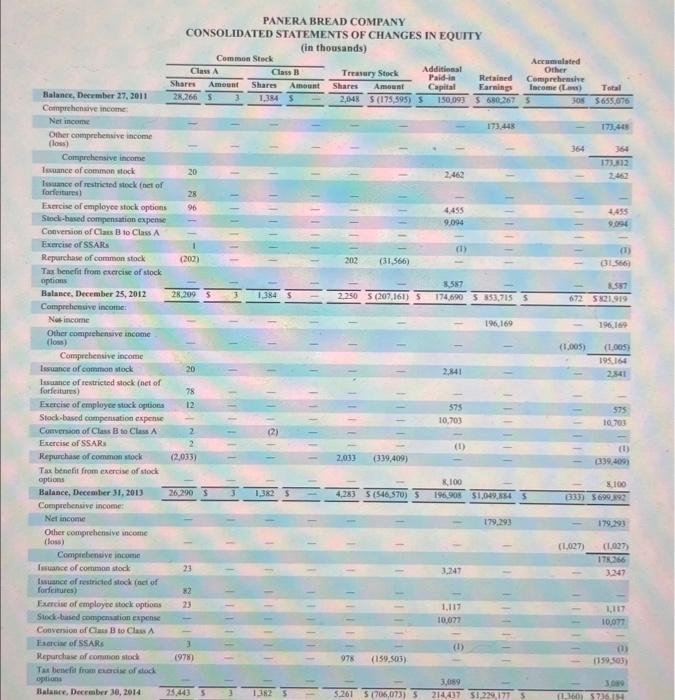
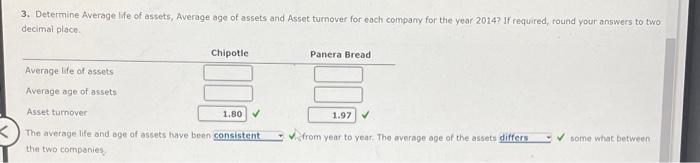
Revenues: Bakery-cafe sales, net Franchise royalties and fees Fresh dough and other product sales to franchisees Total revenues Costs and expenses: Bakery-cafe expenses: Cost of food and paper products Labor Occupancy Other operating expenses Total bakery-cafe expenses Fresh dough and other product cost of sales to franchisees Depreciation and amortization General and administrative expenses Pre-opening expenses Total costs and expenses Operating profit Interest expense Other (income) expense, net Income before income taxes Income taxes mancrat stat nems and notes thereto, Net income Less: net loss attributable to noncontrolling interest Net income attributable to Pancra Bread Company Earnings per common share attributable to Panera Bread Company: Basic Diluted Weighted average shares of common and common equivalent shares outstanding: Basic Diluted December 30, December 31, 2014 2013 For the fiscal year ended (1) (in thousands, except per share and percentage information) $ 2,230,370 $ 2,108,908. 123,686 112,641 S S 175,139 2,529,195 669,860 685,576 159,794 314,879 1,830,109 152,267 124,109 138,060 8,707 2,253,252 275,943 1,824 (3,175) 277,294 98,001 179,293 163,453 2,385,002 26,881 26,999 142,160 106,523 123,335 7,794 2,075,246 309,756 $ 625,622 S 552,580 $ 625,457 559,446 148,816 130,793 295,539 256,029 1,695,434 1,498,848 1,053 (4,017) 312,720 116,551 196,169 December 25, December 27, December 28, 2012 2011 2010 $ 1,879,280 $ 1,592,951 102,076 92,793 179,293 S 196,169 S 6.67 S 6.85 S 6.64 $6.81 28,629 28,794 148,701 2,130,057 131,006 90,939 117,932 8,462 1,847,187 282,870 1,082 (1,208) 282,996 109,548 173,448 173.448 $ 5.94 $ 5.89 S 29,217 29,455 136,288 1,822,032 470,398 S 484,014 115,290 216,237 1,285,939 116,267 79,899 113,083 6,585 1,601,773 220,259 822 (466) 219,903 83,951 135,952 S 1,321,162 86,195 135,952 S 4.59 S 4.55 S 29,601 29,903 135,132 1,542,489 374,816 419,140 100,970 177,059 1,071,985 110,986 68,673 101,4941 4,282 1,357,420 185,069 675 4,232 180,162 68,563 111,599 (267) 111,866 3.65 3.62 30,614 30,922 Consolidated balance sheet data: Cash and cash equivalents Prepaid expenses and other Property and equipment, net Total assets Current liabilities Long-term liabilities Stockholders' equity Franchisee revenues (2) Comparable net bakery-cafe sales percentage for (2)(3): Company-owned bakery-cafes Franchise-operated bakery-cafes Bakery-cafe data: Company-owned bakery-cafes open Franchise-operated bakery-cafes open Total bakery-cafes open For the fiscal year ended (1) (in thousands, except per share and percentage information) December 30, December 31, 2014 2013 196,493 51,588 787,294 1,390,902 352,712 302,006 736,184 $ 2,281,755 1.4% 0.9% 925 955 1,880 S 125,245 43,064 23,905 669,409 444,094 1,180,862 924,581 303,325 238,334 211,516 177,645 133,912 117,457 699,892 655,076 595,608 $ 2,175,155 $ 1,981,674 $ 1,828,188 $ 1,802,116 2.6% 2.0% December 25, December 27, December 28, 2012 2011 2010 867 910 1,777 $ 297,141 42,223 571,754 1,268,163 277,540 168,704 821,919 6.5% 5.0% 809 843 1,652 S 222,640 $ 229,299 31,228 492,022 1,027,322 4.9% 3.4% 740 801 1,541 7.5% 8.2% 662 791 1,453 ASSETS Current assets: Cash and cash equivalents Trade accounts receivable, net Other accounts receivable Inventories Prepaid expenses and other Deferred income taxes Total current assets Property and equipment, net Other assets: Goodwill Other intangible assets, net Deposits and other Total other assets Total assets LIABILITIES Current liabilities: Accounts payable Accrued expenses Total current liabilities i PANERA BREAD COMPANY CONSOLIDATED BALANCE SHEETS (in thousands, except share and per share information) Long-term debt Deferred rent Deferred income taxes Other long-term liabilities Total liabilities Commitments and contingencies (Note 13) STOCKHOLDERS' EQUITY Common stock, S.0001 par value per share: Class A, 112,500,000 shares authorized: 30,703,472 shares issued and 25,442,728 shares outstanding at December 30, 2014 and 30,573,851 shares issued and 26,290,446 shares outstanding at December 31, 2013 Class B, 10,000,000 shares authorized; 1,381,865 shares issued and outstanding at December 30, 2014 and 1,382,393 shares issued and outstanding at December 31, 2013 Treasury stock, carried at cost; 5,260,744 shares at December 30, 2014 and 4,283,405 shares at December 31, 2013 Preferred stock, $.0001 par value per share; 2,000,000 shares authorized and no shares issued or outstanding at December 30, 2014 and December 31, 2013 Additional paid-in capital Accumulated other comprehensive (loss) income Retained earnings Total stockholders' equity December 30, December 31, 2014 2013 S 196,493 $ 125,245 36,584 32,965 51,637 21,916 70,069 22,811 51,588 28,621 406,166 787,294 120,778 70,940 5,724 197,442 S 1,390,902 S 19,511 S 333,201 352,712 100,000 67,390 76,589 58,027 654,718 3 (706,073) 214,437 (1,360) 1,229,177 736,184 43,064 27,889 302,716 669,409 123,013 79,768 5,956 208,737 1,180,862 17,533 285,792 303,325 65,974 65,398 46,273 480,970 3 (546,570) 196,908 (333) 1,049,884 699,892 Revenues: Bakery-cafe sales, net Franchise royalties and fees Fresh dough and other product sales to franchisees Total revenues Costs and expenses: Bakery-cafe expenses: Cost of food and paper products Labor PANERA BREAD COMPANY CONSOLIDATED STATEMENTS OF COMPREHENSIVE INCOME (in thousands, except per share information) Occupancy Other operating expenses Total bakery-cafe expenses Fresh dough and other product cost of sales to franchisees Depreciation and amortization General and administrative expenses Pre-opening expenses Total costs and expenses Operating profit Interest expense Other (income) expense, net Income before income taxes Income taxes Net income Earnings per common share: Basic Diluted Weighted average shares of common and common equivalent shares outstanding: Basic Diluted Other comprehensive income (loss), net of tax: Foreign currency translation adjustment Other comprehensive (loss) income Comprehensive income For the fiscal year ended December 30, December 31, December 25, 2014 2013 2012 S 2,230,370 S 123,686 175,139 $ 2,529,195 S S S $ S S S 669,860 S 685,576 159,794 314,879 1,830,109 152,267 124,109 138,060 8,707 2,253,252 275,943 1,824 (3,175) 277,294 98,001 179,293 S 6.67 S 6.64 S 26,881 26,999 (1,027) S (1,027) S 178,266 S 2,108,908 $ 1,879,280 112,641 102,076 163,453 148,701 2,385,002 S 2,130,057 625,622 S 625,457 148,816 295,539 1,695,434 142,160 106,523 123,335 7,794 2,075,246 309,756 1,053 (4,017) 312,720 116,551 196,169 $ 6.85 S 6.81 $ 28,629 28,794 (1,005) S (1,005) S 195,164 $ 552,580 559,446 130,793 256,029 1,498,848 131,006 90,939 117,932 8,462 1,847,187 282,870 1,082 (1,208) 282,996 109,548 173,448 5.94 5.89 29,217 29,455 364 364 173,812 PANERA BREAD COMPANY CONSOLIDATED STATEMENTS OF CASH FLOWS (in thousands) Cash flows from operations: Net income Adjustments to reconcile net income to net cash provided by operating activities: Depreciation and amortization Stock-based compensation expense Tax benefit from exercise of stock options Deferred income taxes Loss on disposals of property and equipment Other Changes in operating assets and liabilities, excluding the effect of acquisitions and dispositions: Trade and other accounts receivable, net Inventories Prepaid expenses and other Deposits and other i Accounts payable Accrued expenses Deferred rent Other long-term liabilities Net cash provided by operating activities Cash flows from investing activities: Additions to property and equipment Acquisitions, net of cash acquired Purchase of investments Proceeds from sale of investments Proceeds from sale-leaseback transactions Net cash used in investing activities Cash flows from financing activities: Proceeds from issuance of long-term debt Debt issuance costs Repurchase of common stock Exercise of employee stock options Tax benefit from exercise of stock options Proceeds from issuance of common stock under employee benefit plans Payment of deferred acquisition holdback Net cash used in financing activities Net increase (decrease) in cash and cash equivalents Cash and cash equivalents at beginning of period Cash and cash equivalents at end of period For the fiscal year ended December 30, December 31, December 25, 2014 2013 2012 179,293 S 124,109 10,077 (3,089) 10,459 1,547 3,070 (22,139) (895) (8,524) 239 1,978 35,288 1,067 2,599 335,079 (224,217) 12,900 (211,317) 196,169 S 106,5235 10,703 (8,100) 10,356 5,764 589 3,021 (2,186) (841) 1,449 8,162 13,372 5,868 (2,432) 348,417 (192,010) (2,446) (97,919) 97,936 6,132 (188,307) 100,000 (193) (159,503) (339,409) 1,116 573 3,089 8,100 3,247 2,842 (270) (4,112) (52,514) (332,006) 71,248 (171,896) 125,245 297,141 196,493 S 125,245 S 173,448 90,939 9,094 (8,587) 20,334 3,995 475 (31,414) (2,440) (10,995) 161 (6,513) 49,246 5,718 (4,005) 289,456 (152,328) (47,951) 4,538 (195,741) (1,097) (31,566) 4,455 8,587 2,462 (2,055) (19,214) 74,501 222,640 297,141 Balance, December 27, 2011 Comprehensive income Net income Other comprehensive income (loss) Comprehensive income Issuance of common stock Issuance of restricted stock (net of forfeitures) Exercise of employee stock options Stock-based compensation expense Conversion of Class B to Class A Exercise of SSAR Repurchase of common stock Tax benefit from exercise of stock options Balance, December 25, 2012 Comprehensive income: Nos income Other comprehensive income (loss) Comprehensive income Issuance of common stock Issuance of restricted stock (net of forfeitures) Exercise of employee stock options Stock-based compensation expense Conversion of Class B to Class A Exercise of SSAR Repurchase of common stock Tax benefit from exercise of stock options Balance, December 31, 2013 Comprehensive income: Net income Other comprehensive income (loss) Comprehensive income Issuance of common stock Issuance of restricted stock (net of forfeitures) Exercise of employee stock options Stock-based compensation expense Conversion of Class B to Class A Exercise of S Repurchase of common stock Tax benefit from exercise of stock options Balance, December 30, 2014 PANERA BREAD COMPANY CONSOLIDATED STATEMENTS OF CHANGES IN EQUITY (in thousands) Class A Class B Shares Amount Shares Amount 28,266 S 1,384 20 28 96 (202) 28,209 S 20 22INNE 78 12 (2,033) 26,290 S 23 82 23 3 (978) Common Stock 25,443 TIE 11111. 1 III 11 1,384 S ||||||| 1,382 1 IIIIIII 1,382 1 TETIT TE 1 111 Additional Paid-in Accumulated Other Treasury Stock Retained Comprehensive Shares Amount Capital Earnings Income (Low) 2,048 $(175,595) S 150,093 $ 680,267 5 11111 202 (31,566) 11111118 2,250 S (207,161) S 2.033 (339,409) 1 11111118 2111111 11111115 2,462 978 (159,503) 4,455 9,094 (1) 2,841 8,587 174,690 S853,715 5 575 10,703 (1) 8,100 4,283 $(546,570) S 196,908 $1,049,854 3,247 173,448 1,117 1111III 10,077 SIITIE 196,169 179,293 TIT 3,089 5.261 $(706,073) S 214,437 $1,229,177 S Total 308 $655,076 364 LIFE 173,448 11111 364 173,812 2,462 4,455 9,094 8,587 672 5821,919 (1) (31,566) 111111 (1,005) (1,005) 195,164 2341 196,169 575 10,703 (1) (339,409) 8,100 (333) $699,892 179,293 (1,027) (1,027) 178,266 3,247 1,117 10,077 (1) (159,503) 3,089 (1,360) $736.154 K 3. Determine Average life of assets, Average age of assets and Asset turnover for each company for the year 2014? If required, round your answers to two decimal place. Average life of assets Average age of assets Asset turnover Chipotle 1.80 ✔ The average life and age of assets have been consistent the two companies Panera Bread 1.97 ✔ from year to year. The average age of the assets differs some what between Revenues: Bakery-cafe sales, net Franchise royalties and fees Fresh dough and other product sales to franchisees Total revenues Costs and expenses: Bakery-cafe expenses: Cost of food and paper products Labor Occupancy Other operating expenses Total bakery-cafe expenses Fresh dough and other product cost of sales to franchisees Depreciation and amortization General and administrative expenses Pre-opening expenses Total costs and expenses Operating profit Interest expense Other (income) expense, net Income before income taxes Income taxes mancrat stat nems and notes thereto, Net income Less: net loss attributable to noncontrolling interest Net income attributable to Pancra Bread Company Earnings per common share attributable to Panera Bread Company: Basic Diluted Weighted average shares of common and common equivalent shares outstanding: Basic Diluted December 30, December 31, 2014 2013 For the fiscal year ended (1) (in thousands, except per share and percentage information) $ 2,230,370 $ 2,108,908. 123,686 112,641 S S 175,139 2,529,195 669,860 685,576 159,794 314,879 1,830,109 152,267 124,109 138,060 8,707 2,253,252 275,943 1,824 (3,175) 277,294 98,001 179,293 163,453 2,385,002 26,881 26,999 142,160 106,523 123,335 7,794 2,075,246 309,756 $ 625,622 S 552,580 $ 625,457 559,446 148,816 130,793 295,539 256,029 1,695,434 1,498,848 1,053 (4,017) 312,720 116,551 196,169 December 25, December 27, December 28, 2012 2011 2010 $ 1,879,280 $ 1,592,951 102,076 92,793 179,293 S 196,169 S 6.67 S 6.85 S 6.64 $6.81 28,629 28,794 148,701 2,130,057 131,006 90,939 117,932 8,462 1,847,187 282,870 1,082 (1,208) 282,996 109,548 173,448 173.448 $ 5.94 $ 5.89 S 29,217 29,455 136,288 1,822,032 470,398 S 484,014 115,290 216,237 1,285,939 116,267 79,899 113,083 6,585 1,601,773 220,259 822 (466) 219,903 83,951 135,952 S 1,321,162 86,195 135,952 S 4.59 S 4.55 S 29,601 29,903 135,132 1,542,489 374,816 419,140 100,970 177,059 1,071,985 110,986 68,673 101,4941 4,282 1,357,420 185,069 675 4,232 180,162 68,563 111,599 (267) 111,866 3.65 3.62 30,614 30,922 Consolidated balance sheet data: Cash and cash equivalents Prepaid expenses and other Property and equipment, net Total assets Current liabilities Long-term liabilities Stockholders' equity Franchisee revenues (2) Comparable net bakery-cafe sales percentage for (2)(3): Company-owned bakery-cafes Franchise-operated bakery-cafes Bakery-cafe data: Company-owned bakery-cafes open Franchise-operated bakery-cafes open Total bakery-cafes open For the fiscal year ended (1) (in thousands, except per share and percentage information) December 30, December 31, 2014 2013 196,493 51,588 787,294 1,390,902 352,712 302,006 736,184 $ 2,281,755 1.4% 0.9% 925 955 1,880 S 125,245 43,064 23,905 669,409 444,094 1,180,862 924,581 303,325 238,334 211,516 177,645 133,912 117,457 699,892 655,076 595,608 $ 2,175,155 $ 1,981,674 $ 1,828,188 $ 1,802,116 2.6% 2.0% December 25, December 27, December 28, 2012 2011 2010 867 910 1,777 $ 297,141 42,223 571,754 1,268,163 277,540 168,704 821,919 6.5% 5.0% 809 843 1,652 S 222,640 $ 229,299 31,228 492,022 1,027,322 4.9% 3.4% 740 801 1,541 7.5% 8.2% 662 791 1,453 ASSETS Current assets: Cash and cash equivalents Trade accounts receivable, net Other accounts receivable Inventories Prepaid expenses and other Deferred income taxes Total current assets Property and equipment, net Other assets: Goodwill Other intangible assets, net Deposits and other Total other assets Total assets LIABILITIES Current liabilities: Accounts payable Accrued expenses Total current liabilities i PANERA BREAD COMPANY CONSOLIDATED BALANCE SHEETS (in thousands, except share and per share information) Long-term debt Deferred rent Deferred income taxes Other long-term liabilities Total liabilities Commitments and contingencies (Note 13) STOCKHOLDERS' EQUITY Common stock, S.0001 par value per share: Class A, 112,500,000 shares authorized: 30,703,472 shares issued and 25,442,728 shares outstanding at December 30, 2014 and 30,573,851 shares issued and 26,290,446 shares outstanding at December 31, 2013 Class B, 10,000,000 shares authorized; 1,381,865 shares issued and outstanding at December 30, 2014 and 1,382,393 shares issued and outstanding at December 31, 2013 Treasury stock, carried at cost; 5,260,744 shares at December 30, 2014 and 4,283,405 shares at December 31, 2013 Preferred stock, $.0001 par value per share; 2,000,000 shares authorized and no shares issued or outstanding at December 30, 2014 and December 31, 2013 Additional paid-in capital Accumulated other comprehensive (loss) income Retained earnings Total stockholders' equity December 30, December 31, 2014 2013 S 196,493 $ 125,245 36,584 32,965 51,637 21,916 70,069 22,811 51,588 28,621 406,166 787,294 120,778 70,940 5,724 197,442 S 1,390,902 S 19,511 S 333,201 352,712 100,000 67,390 76,589 58,027 654,718 3 (706,073) 214,437 (1,360) 1,229,177 736,184 43,064 27,889 302,716 669,409 123,013 79,768 5,956 208,737 1,180,862 17,533 285,792 303,325 65,974 65,398 46,273 480,970 3 (546,570) 196,908 (333) 1,049,884 699,892 Revenues: Bakery-cafe sales, net Franchise royalties and fees Fresh dough and other product sales to franchisees Total revenues Costs and expenses: Bakery-cafe expenses: Cost of food and paper products Labor PANERA BREAD COMPANY CONSOLIDATED STATEMENTS OF COMPREHENSIVE INCOME (in thousands, except per share information) Occupancy Other operating expenses Total bakery-cafe expenses Fresh dough and other product cost of sales to franchisees Depreciation and amortization General and administrative expenses Pre-opening expenses Total costs and expenses Operating profit Interest expense Other (income) expense, net Income before income taxes Income taxes Net income Earnings per common share: Basic Diluted Weighted average shares of common and common equivalent shares outstanding: Basic Diluted Other comprehensive income (loss), net of tax: Foreign currency translation adjustment Other comprehensive (loss) income Comprehensive income For the fiscal year ended December 30, December 31, December 25, 2014 2013 2012 S 2,230,370 S 123,686 175,139 $ 2,529,195 S S S $ S S S 669,860 S 685,576 159,794 314,879 1,830,109 152,267 124,109 138,060 8,707 2,253,252 275,943 1,824 (3,175) 277,294 98,001 179,293 S 6.67 S 6.64 S 26,881 26,999 (1,027) S (1,027) S 178,266 S 2,108,908 $ 1,879,280 112,641 102,076 163,453 148,701 2,385,002 S 2,130,057 625,622 S 625,457 148,816 295,539 1,695,434 142,160 106,523 123,335 7,794 2,075,246 309,756 1,053 (4,017) 312,720 116,551 196,169 $ 6.85 S 6.81 $ 28,629 28,794 (1,005) S (1,005) S 195,164 $ 552,580 559,446 130,793 256,029 1,498,848 131,006 90,939 117,932 8,462 1,847,187 282,870 1,082 (1,208) 282,996 109,548 173,448 5.94 5.89 29,217 29,455 364 364 173,812 PANERA BREAD COMPANY CONSOLIDATED STATEMENTS OF CASH FLOWS (in thousands) Cash flows from operations: Net income Adjustments to reconcile net income to net cash provided by operating activities: Depreciation and amortization Stock-based compensation expense Tax benefit from exercise of stock options Deferred income taxes Loss on disposals of property and equipment Other Changes in operating assets and liabilities, excluding the effect of acquisitions and dispositions: Trade and other accounts receivable, net Inventories Prepaid expenses and other Deposits and other i Accounts payable Accrued expenses Deferred rent Other long-term liabilities Net cash provided by operating activities Cash flows from investing activities: Additions to property and equipment Acquisitions, net of cash acquired Purchase of investments Proceeds from sale of investments Proceeds from sale-leaseback transactions Net cash used in investing activities Cash flows from financing activities: Proceeds from issuance of long-term debt Debt issuance costs Repurchase of common stock Exercise of employee stock options Tax benefit from exercise of stock options Proceeds from issuance of common stock under employee benefit plans Payment of deferred acquisition holdback Net cash used in financing activities Net increase (decrease) in cash and cash equivalents Cash and cash equivalents at beginning of period Cash and cash equivalents at end of period For the fiscal year ended December 30, December 31, December 25, 2014 2013 2012 179,293 S 124,109 10,077 (3,089) 10,459 1,547 3,070 (22,139) (895) (8,524) 239 1,978 35,288 1,067 2,599 335,079 (224,217) 12,900 (211,317) 196,169 S 106,5235 10,703 (8,100) 10,356 5,764 589 3,021 (2,186) (841) 1,449 8,162 13,372 5,868 (2,432) 348,417 (192,010) (2,446) (97,919) 97,936 6,132 (188,307) 100,000 (193) (159,503) (339,409) 1,116 573 3,089 8,100 3,247 2,842 (270) (4,112) (52,514) (332,006) 71,248 (171,896) 125,245 297,141 196,493 S 125,245 S 173,448 90,939 9,094 (8,587) 20,334 3,995 475 (31,414) (2,440) (10,995) 161 (6,513) 49,246 5,718 (4,005) 289,456 (152,328) (47,951) 4,538 (195,741) (1,097) (31,566) 4,455 8,587 2,462 (2,055) (19,214) 74,501 222,640 297,141 Balance, December 27, 2011 Comprehensive income Net income Other comprehensive income (loss) Comprehensive income Issuance of common stock Issuance of restricted stock (net of forfeitures) Exercise of employee stock options Stock-based compensation expense Conversion of Class B to Class A Exercise of SSAR Repurchase of common stock Tax benefit from exercise of stock options Balance, December 25, 2012 Comprehensive income: Nos income Other comprehensive income (loss) Comprehensive income Issuance of common stock Issuance of restricted stock (net of forfeitures) Exercise of employee stock options Stock-based compensation expense Conversion of Class B to Class A Exercise of SSAR Repurchase of common stock Tax benefit from exercise of stock options Balance, December 31, 2013 Comprehensive income: Net income Other comprehensive income (loss) Comprehensive income Issuance of common stock Issuance of restricted stock (net of forfeitures) Exercise of employee stock options Stock-based compensation expense Conversion of Class B to Class A Exercise of S Repurchase of common stock Tax benefit from exercise of stock options Balance, December 30, 2014 PANERA BREAD COMPANY CONSOLIDATED STATEMENTS OF CHANGES IN EQUITY (in thousands) Class A Class B Shares Amount Shares Amount 28,266 S 1,384 20 28 96 (202) 28,209 S 20 22INNE 78 12 (2,033) 26,290 S 23 82 23 3 (978) Common Stock 25,443 TIE 11111. 1 III 11 1,384 S ||||||| 1,382 1 IIIIIII 1,382 1 TETIT TE 1 111 Additional Paid-in Accumulated Other Treasury Stock Retained Comprehensive Shares Amount Capital Earnings Income (Low) 2,048 $(175,595) S 150,093 $ 680,267 5 11111 202 (31,566) 11111118 2,250 S (207,161) S 2.033 (339,409) 1 11111118 2111111 11111115 2,462 978 (159,503) 4,455 9,094 (1) 2,841 8,587 174,690 S853,715 5 575 10,703 (1) 8,100 4,283 $(546,570) S 196,908 $1,049,854 3,247 173,448 1,117 1111III 10,077 SIITIE 196,169 179,293 TIT 3,089 5.261 $(706,073) S 214,437 $1,229,177 S Total 308 $655,076 364 LIFE 173,448 11111 364 173,812 2,462 4,455 9,094 8,587 672 5821,919 (1) (31,566) 111111 (1,005) (1,005) 195,164 2341 196,169 575 10,703 (1) (339,409) 8,100 (333) $699,892 179,293 (1,027) (1,027) 178,266 3,247 1,117 10,077 (1) (159,503) 3,089 (1,360) $736.154 K 3. Determine Average life of assets, Average age of assets and Asset turnover for each company for the year 2014? If required, round your answers to two decimal place. Average life of assets Average age of assets Asset turnover Chipotle 1.80 ✔ The average life and age of assets have been consistent the two companies Panera Bread 1.97 ✔ from year to year. The average age of the assets differs some what between
Expert Answer:
Answer rating: 100% (QA)
Panera Bread a Average life of assets Panera Bread Company ... View the full answer

Related Book For 
Posted Date:
Students also viewed these accounting questions
-
The Starlight, Inc. financial statements for the fiscal year ended June 30, 2013, are presented below. The firm's sales are projected to grow at a rate of 20 percent next year, and all financial...
-
For the fiscal year ended April 30, 2015, Interform Corp. had the following account balances: Dr (Cr) Accounts receivable ............. $ 5,102,050 Notes receivable, due January 2016 ..........
-
The following information regarding the fiscal year ended December 31, 2016, was drawn from the accounts and records of the Volendam County general fund: Revenues and Other Asset Inflows Taxes...
-
What is your perspective on changes in cultural ideals for the female body from that of Marilyn Monroe in the 1950s to top models today?
-
Look at the financial statements of the FORD MOTOR Company. Calculate the following ratios for FORD: asset turnover, profit margin on sales, return on assets and return on equity. Post the...
-
During a basketball game, the Lancers scored 15 points in the first quarter, 2/7 of their total score in the second quarter, 1/4 of their total score in the third quarter, and the remaining 11 points...
-
In a boiler trial observations made are as: Feed water temperature \(=30^{\circ} \mathrm{C}\) Boiler pressure \(\quad=12 \mathrm{bar}\) Dryness fraction of steam \(=0.80\) Coal consumption...
-
Safe Sailing manufactures flotation vests in Tampa, Florida. Safe Sailings contribution margin income statement for the month ended December 31, 2012, contains the following data: Suppose Overtown...
-
i need help with this question with an explanation thanks! 7) Large Co. pays its employees $20,000 gross salary each week. 30% of salary is withheld for income taxes and 5% is withheld to pay Social...
-
You are an Examiner for the Refund Integrity Program in the GST/HST Audit Division of the Canada Revenue Agency (CRA). Using sophisticated analytical tools, you are able to identify GST/HST returns...
-
Balance sheet at the end of period 4 shows I have liabilities of about $3,000 to pay back a loan I took out during period 1. However, according to the CEO simulation I'm participating in, the debt...
-
In the mechanism shown, a bent lever CBD is pivoted at the fixed point C. The angle CBD is 90 The crank rotates anticlockwise at 180 rpm about fixed point O. The crank pin A slides in a closely...
-
niap F0 = f(0) kilograms of fuel. It is released from an orbiter at time zero at height H0 = h(0) with an initial downwards velocity of zero. It must touch down at less than 1 metre per second. Its...
-
Find y(t) = x(t) h(t) for the following signals, where u(t) is unit step signal. x(t) =2u(t) 2u(t - 2) h(t) = u(t+2) - u(t - 1)
-
A perfectly competitive firm faces a price of 14 per unit. It has the following short run cost schedule: Output 0 1 2 3 4 5 6 Total Cost 10 18 24 30 38 50 64 91 120 Find the following: i) Marginal...
-
Why leadership studies are important for organizational development? 2. Please explain Transformational Leadership and Transactional Leadership? What are the differences between Transformational...
-
In 2020, Pop Construction Corp. began work on a contract for $ 3,700,000. Other details follow: 2020 Costs incurred during the...
-
The text defined intrinsic value as the value of an asset given a hypothetically complete understanding of the assets investment characteristics. Discuss why hypothetically is included in the...
-
On April 1, 2003, Rowe Tool Company authorized the sale of $5,000,000 of 6% convertible bonds with interest payment dates of April 1 and October 1. The bonds were sold on July 1, 2003, and mature on...
-
On January 1, 2013, Skull Valley Motors leased a Lincoln Navigator to T. K. "Pusan Boots" Denny. The lease is a 3-year lease requiring a payment of $695 at the end of each month for 36 months. The...
-
1. Which of the following is the true purpose of information presented in notes to the financial statements? (a) To provide disclosures required by generally accepted accounting principles. (b) To...
-
You are setting up a chatbot agency to service marketing, sales and customer services teams. Discuss the advantages and disadvantages of setting up the business as a sole trader or company and the...
-
Principles for Responsible Management Education (PRME) is a not-for-profit entity. It engages business schools to ensure they provide future leaders with the skills needed to balance economic and...
-
Entities are expected to perform in environmental, governance and social areas as well as profit (unless a not-for-profit entity). List some key performance indicators applicable to each sphere.

Study smarter with the SolutionInn App