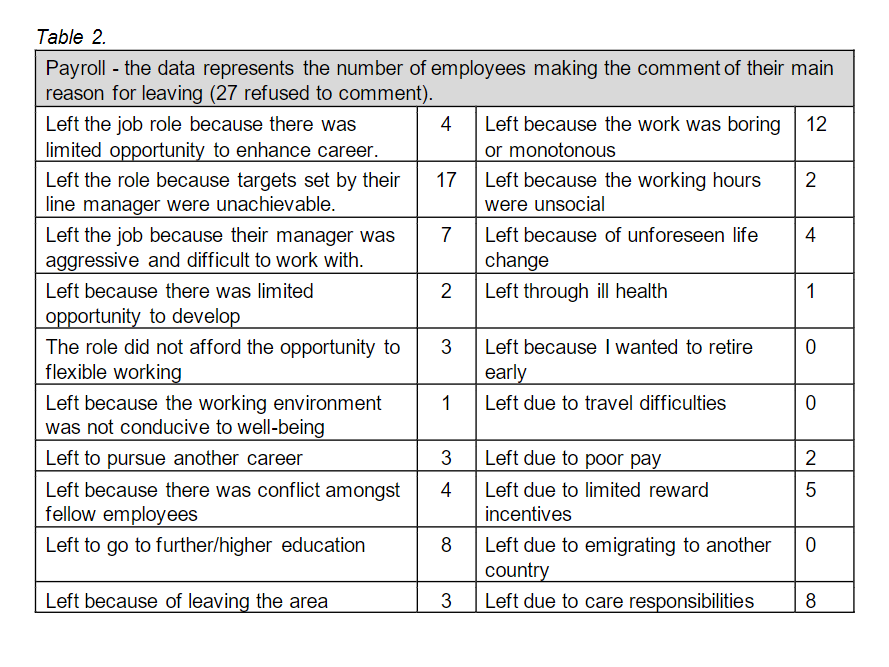
Question: ? Review and analyse the data below. Review the data using appropriate calculations likes percentages Identify the key themes, trends and observations based on your

? Review and analyse the data below. Review the data using appropriate calculations likes percentages Identify the key themes, trends and observations based on your data analysis. Use appropriate presentation techniques like charts, bars, pie charts to present the data

? Review and analyse the data below. Review the
Table 2. Payroll - the data represents the number of employees making the comment of their main reason for leaving (27 refused to comment). Left the job role because there was 4 Left because the work was boring 12 limited opportunity to enhance career. or monotonous Left the role because targets set by their 17 Left because the working hours 2 line manager were unachievable. were unsocial Left the job because their manager was 7 Left because of unforeseen life 4 aggressive and difficult to work with. change Left because there was limited 2 Left through ill health 1 opportunity to develop The role did not afford the opportunity to 3 Left because I wanted to retire 0 flexible working early Left because the working environment 1 Left due to travel difficulties 0 was not conducive to well-being Left to pursue another career 3 Left due to poor pay 2 Left because there was conflict amongst 4 Left due to limited reward 5 fellow employees incentives Left to go to further/higher education 8 Left due to emigrating to another 0 country Left because of leaving the area 3 Left due to care responsibilities 8

Step by Step Solution

There are 3 Steps involved in it

1 Expert Approved Answer
Step: 1 Unlock blur-text-image
Question Has Been Solved by an Expert!

Get step-by-step solutions from verified subject matter experts

Step: 2 Unlock
Step: 3 Unlock

Students Have Also Explored These Related Mathematics Questions!