

Question: Review Case Study This cose study integrotes iry topiar inarned during the first terting period. Start by wotching the frite Lovs SeCvidea to reiate one
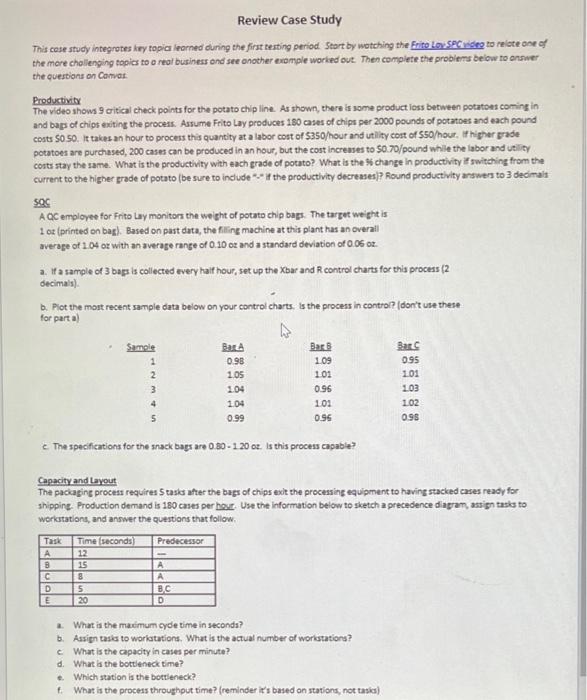
Review Case Study This cose study integrotes iry topiar inarned during the first terting period. Start by wotching the frite Lovs SeCvidea to reiate one of the more challenging topics to a real business and see onother example worked out. Thes complete the problems below to enswer the questions on Camar Productivity The video shows 9 critical check points for the potato chip line. As shown, there is some product iess between potatoes coming in and bags of chips exiting the process. Assume Frito Lay produces 180 cases of chips per 2000 pounds of potatoes and each pound costs 50.50. It takes an hour to process this quantity at a labor cost of 5350 /hour and utility cost of 550 /hour. If higher prade costs stay the same. What is the productivity with each grade of potato? What is the $6 change in productivity if switching from the current to the higher grade of potato (be sure to indude ". if the productivity decreases)? Round productivity arswers to 3 decimals sec A QC employee for Frito Lay monitors the weight of potato chip bags. The target weight is 1 of (printed on bag). Based on past data, the filling machine at this plant has an overall average of 1.04 oz with an average range of 0.10 oz and a standard deviation of 0.06 or. a. If a sample of 3 bags is collected every haif hour, set up the Xbar and R control charts for this process i 2 decimais). b. Piot the most recent sample data below on your control charts. is the process in control? (don't use these for part a) c. The specifications for the snack bags are 0.801.20 ot. Is this process capable? Capacity and layout. The packaging process requires 5 tasid after the bags of chips exit the processing equipment to having stacked cases ready for shipping. Production demand is 180 cases per hour. Use the information below to sketch a precedence diagam, assign tasks to workstations, and answer the questions that follow. a. What is the macmum cyde time in seconds? b. Assign taska to woriatations. What is the actual number of workatations? c. What is the capacity in cases per minute? d. What is the bottieneck time? e. Which station is the botieneck? f. What is the process throughput time? (reminder it's based on stations, not tasic) Part a: Xbar chart LCL (2 decimals) = . Question 5 Part a: Xbar chart UCL (2 decimals) = Question 6 Part a: Range chart UCL (2 decimals) = Part b: Value of first point you would plot on the Xbar chart ( 2 decimals) = Question 8 Part b: Value of last point you would plot on the Xbar chart ( 2 decimals) = Question 9 Part b: Value of first point you would plot on the range chart ( 2 decimals) =
Step by Step Solution
There are 3 Steps involved in it

Get step-by-step solutions from verified subject matter experts