

Question: Review Figure 6-9 on page 106, the workflow chart demonstrating the turnaround time for +K results from the laboratory and Figure 6-10 on page 107
ReviewFigure 6-9 onpage 106,the workflow chart demonstrating the turnaround time for +K results from the laboratory andFigure 6-10 on page 107, XmR chart illustrating lab turnaround time in minutes across 30 specimens from the OR. Answer the following questions.
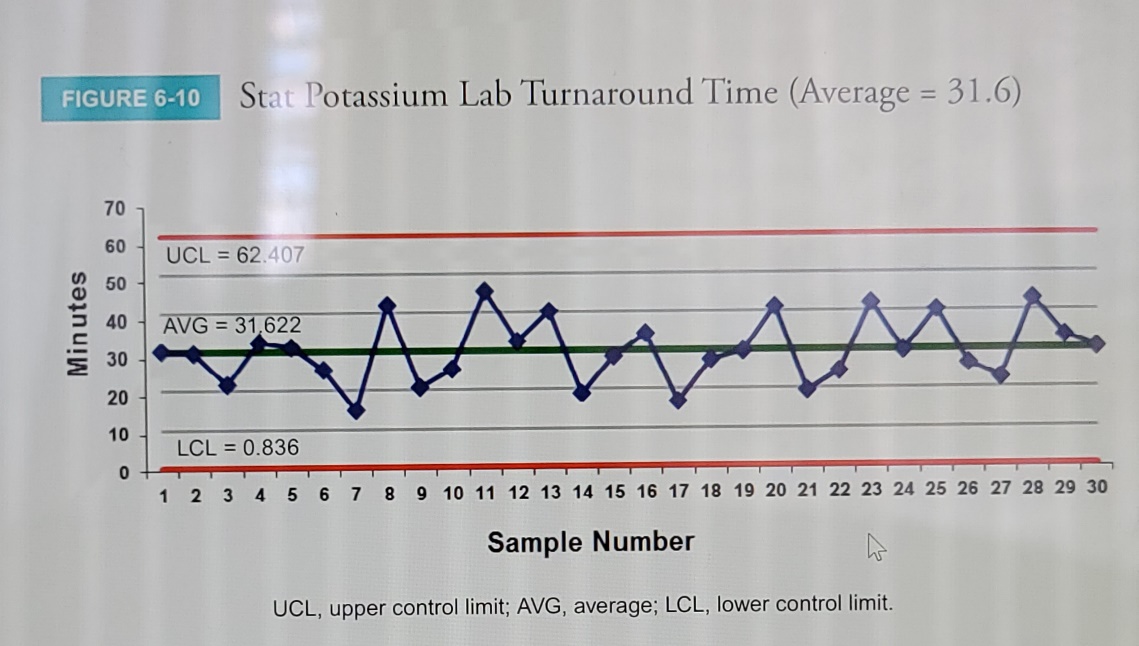
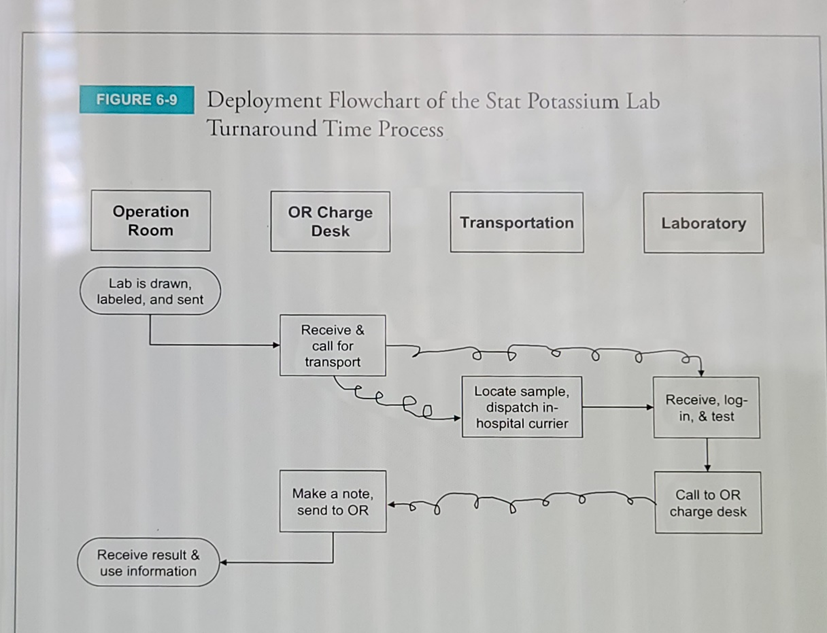
FIGURE 6-10 Stat Potassium Lab Turnaround Time (Average = 31.6) 70 60 UCL = 62.407 50 Minutes 40 AVG = 31.622 30 20 10 LCL = 0.836 0 1 2 3 4 5 6 7 8 9 10 11 12 13 14 15 16 17 18 19 20 21 22 23 24 25 26 27 28 29 30 Sample Number UCL, upper control limit; AVG, average; LCL, lower control limit.FIGURE 6-9 Deployment Flowchart of the Stat Potassium Lab Turnaround Time Process Operation OR Charge Transportation Laboratory Room Desk Lab is drawn, labeled, and sent Receive & call for transport Locate sample, Receive, log- dispatch in- hospital currier in, & test Make a note, Call to OR send to OR charge desk Receive result & use information
Step by Step Solution
There are 3 Steps involved in it

Get step-by-step solutions from verified subject matter experts