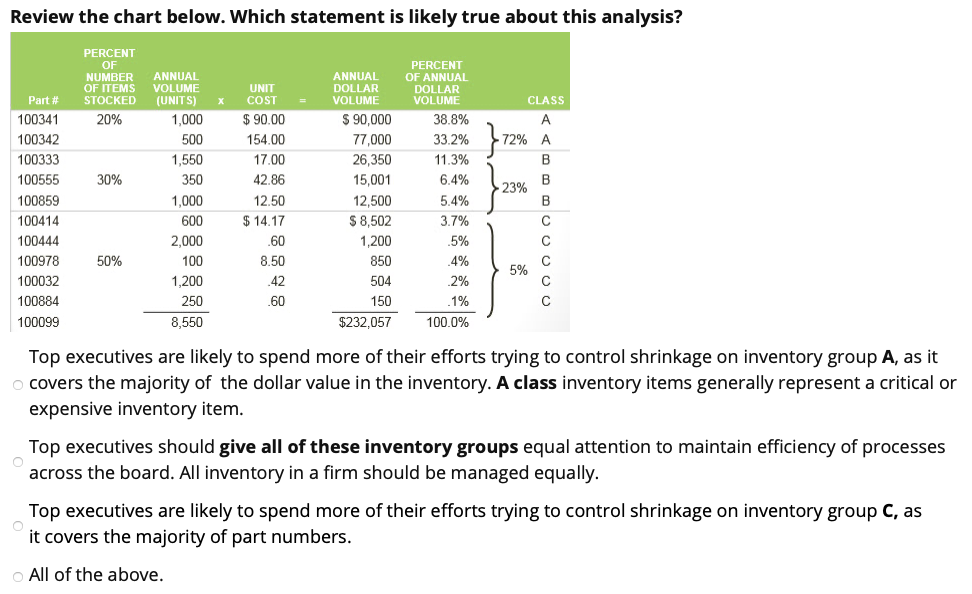
Question: Review the chart below. Which statement is likely true about this analysis? PERCENT OF NUMBER OF ITEMS STOCKED 20% CLASS 72% A B 30% Part#

Review the chart below. Which statement is likely

Review the chart below. Which statement is likely true about this analysis? PERCENT OF NUMBER OF ITEMS STOCKED 20% CLASS 72% A B 30% Part# 100341 100342 100333 100555 100859 100414 100444 100978 100032 100884 100099 ANNUAL VOLUME (UNITS) 1,000 500 1,550 350 1,000 600 2,000 100 1,200 250 8,550 UNIT COST $ 90.00 154.00 17.00 42.86 12.50 $ 14.17 .60 8.50 42 .60 23% PERCENT OF ANNUAL DOLLAR VOLUME 38.8% 33.2% 11.3% 6.4% 5.4% 3.7% .5% 4% .2% 1% 100.0% ANNUAL DOLLAR VOLUME $ 90,000 77,000 26,350 15,001 12,500 $ 8,502 1,200 850 504 150 $232,057 50% 5% Top executives are likely to spend more of their efforts trying to control shrinkage on inventory group A, as it covers the majority of the dollar value in the inventory. A class inventory items generally represent a critical or expensive inventory item. Top executives should give all of these inventory groups equal attention to maintain efficiency of processes across the board. All inventory in a firm should be managed equally. Top executives are likely to spend more of their efforts trying to control shrinkage on inventory group C, as it covers the majority of part numbers. All of the above

Step by Step Solution

There are 3 Steps involved in it

1 Expert Approved Answer
Step: 1 Unlock blur-text-image
Question Has Been Solved by an Expert!

Get step-by-step solutions from verified subject matter experts

Step: 2 Unlock
Step: 3 Unlock

Students Have Also Explored These Related General Management Questions!