

Question: Review the charts and graphs and complete the Data Visualization types of Worksheet. B x x AV ~ Aav A Convert to Picture A Text
Review the charts and graphs and complete the Data Visualization types of Worksheet.
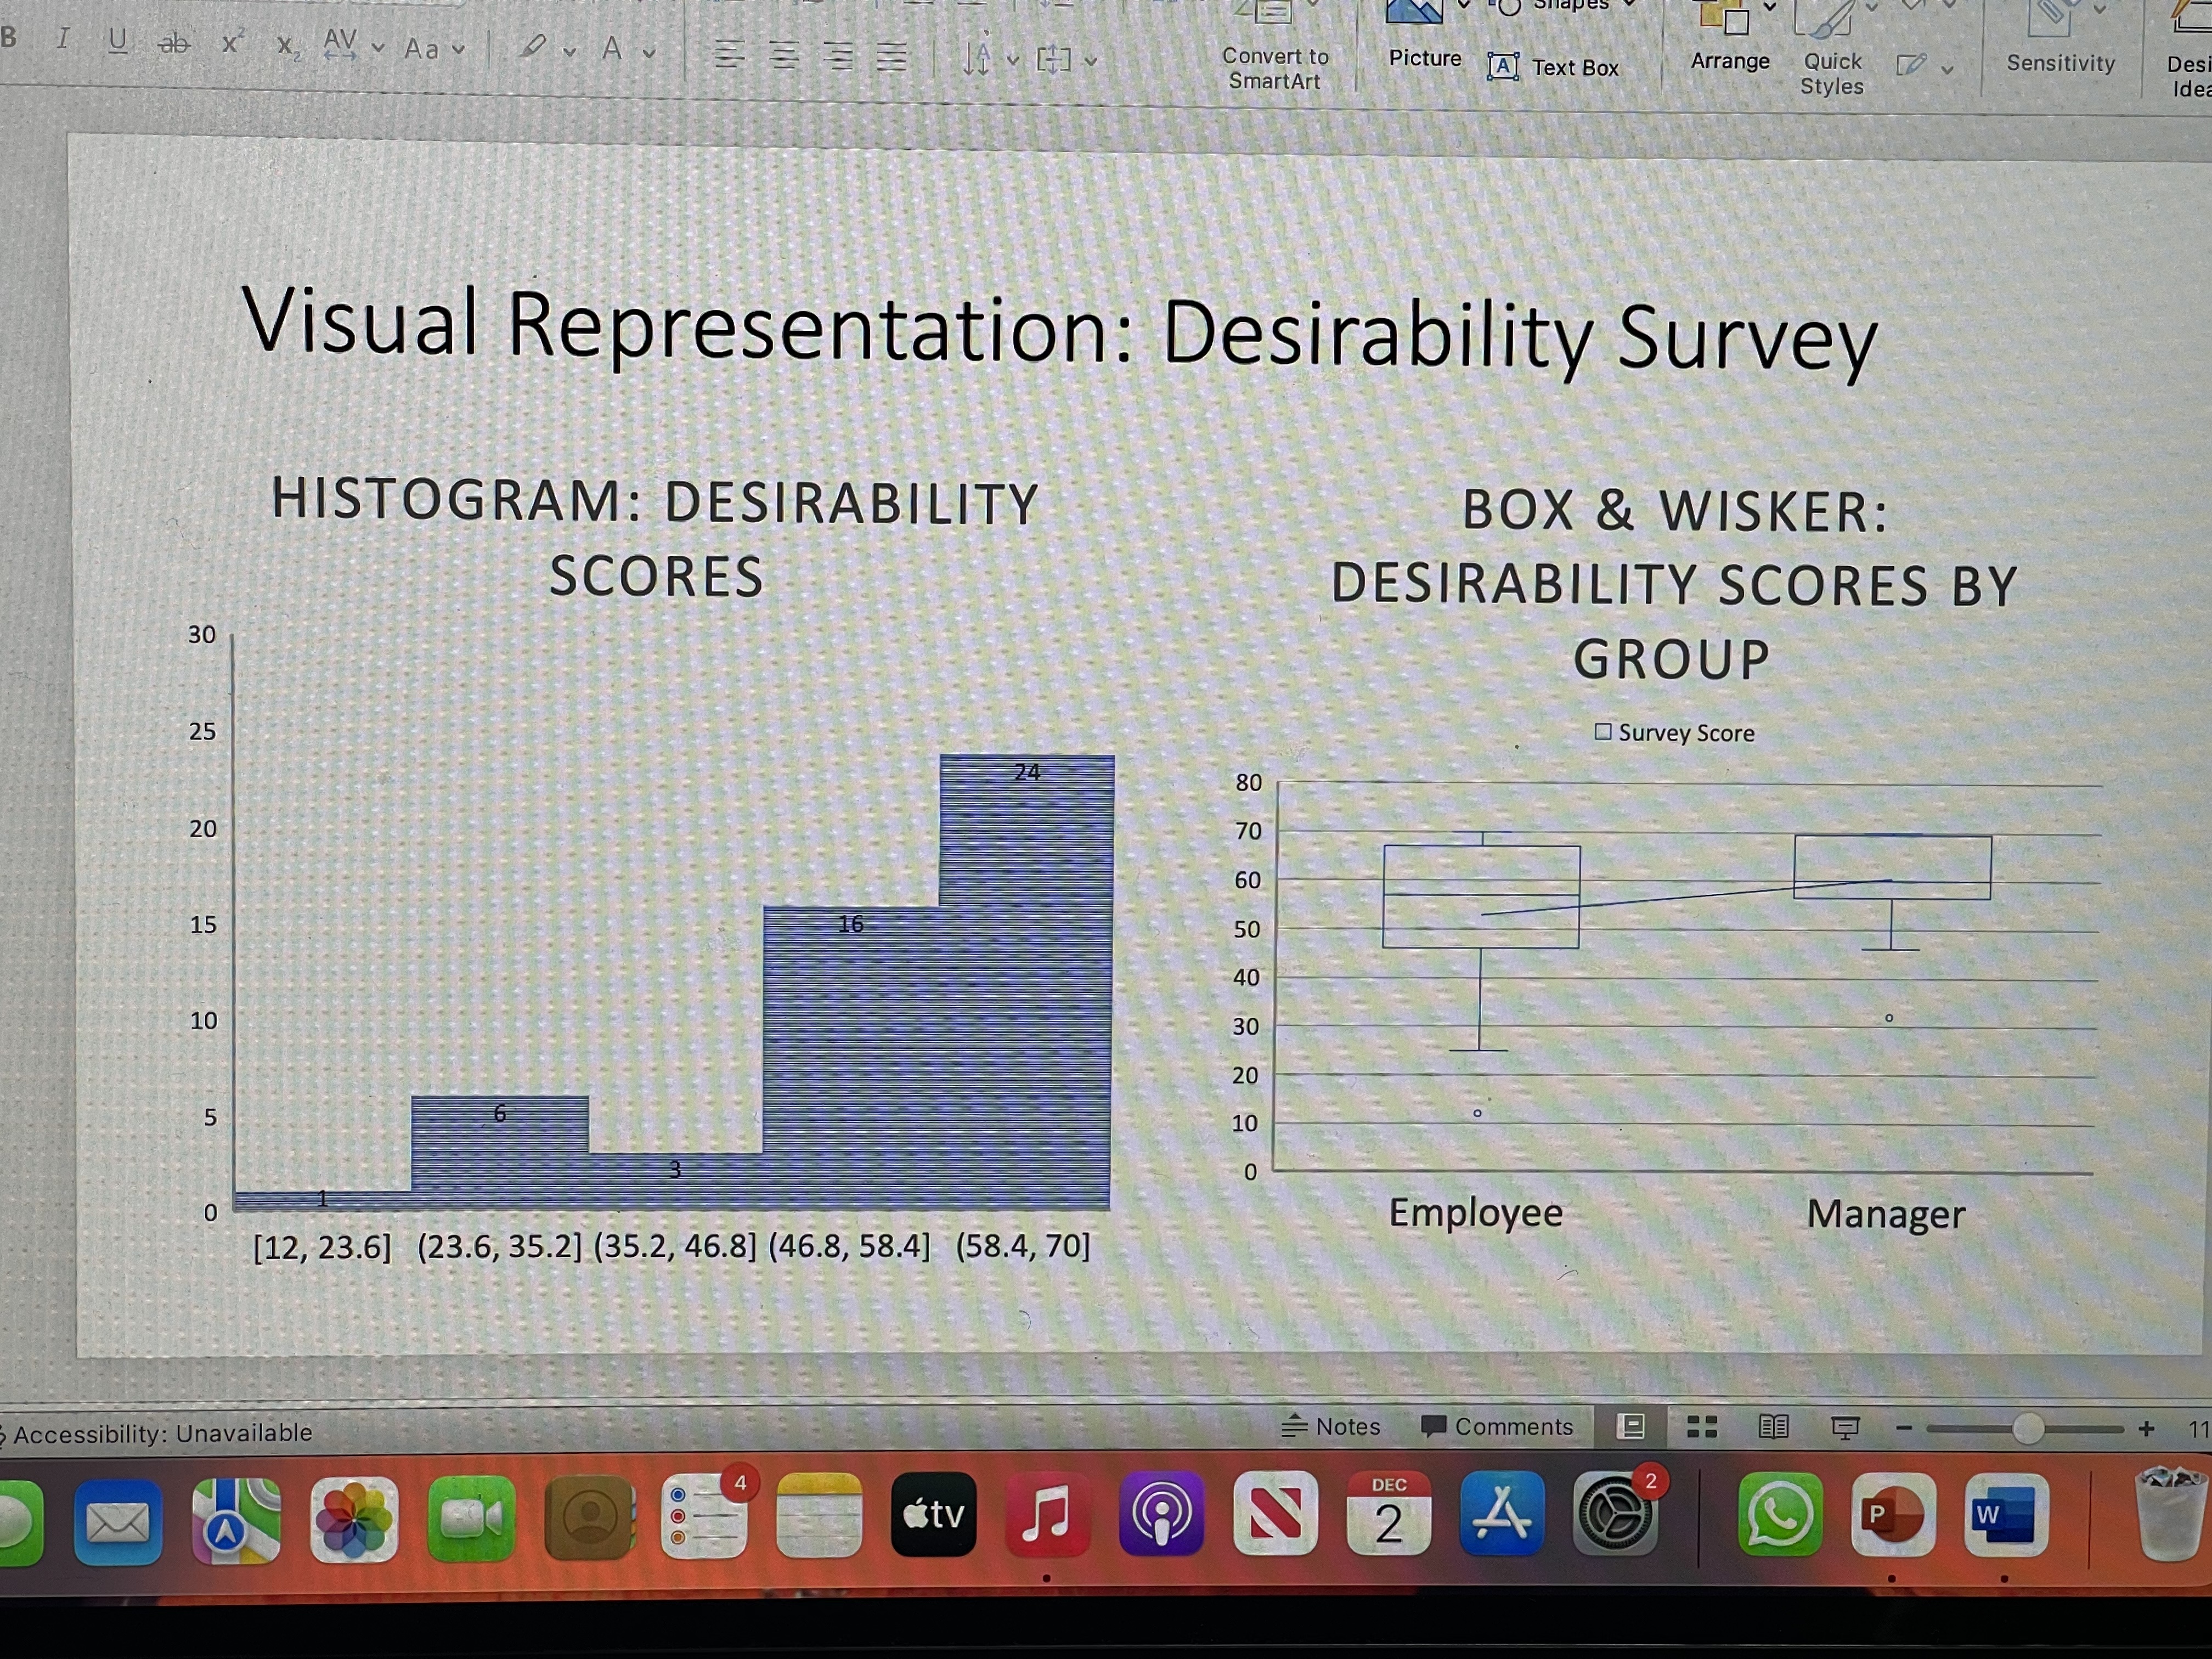
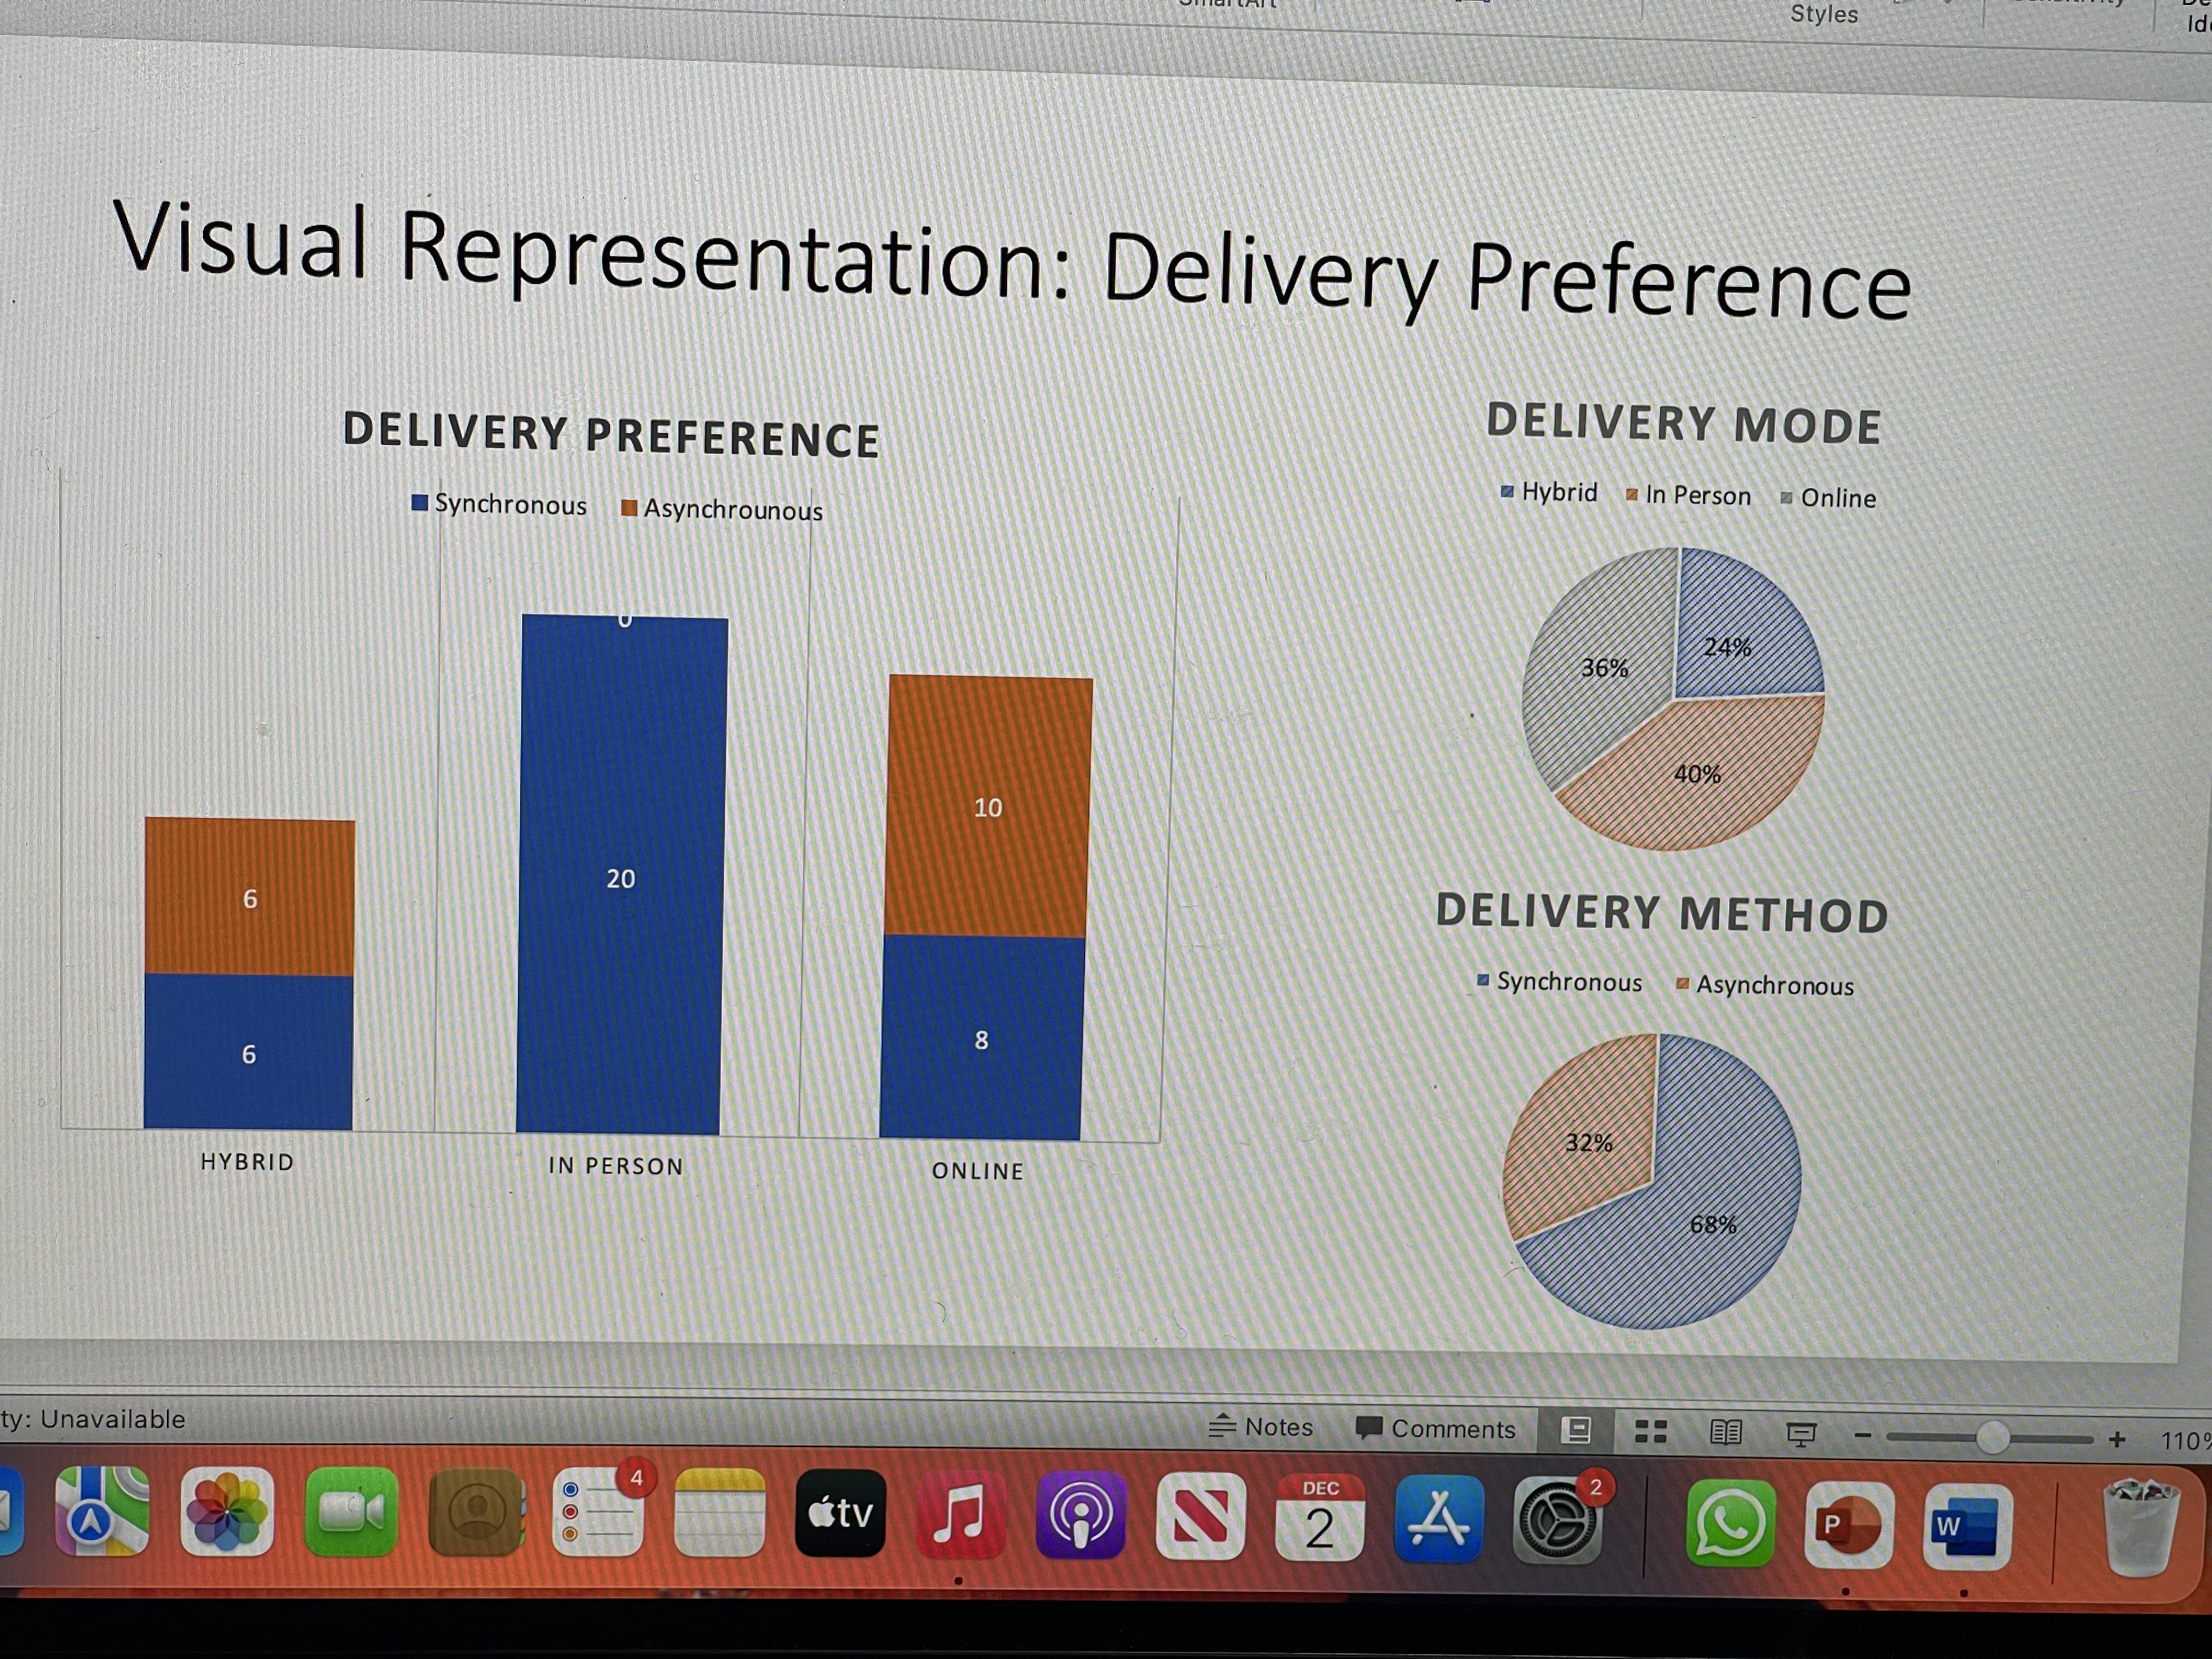
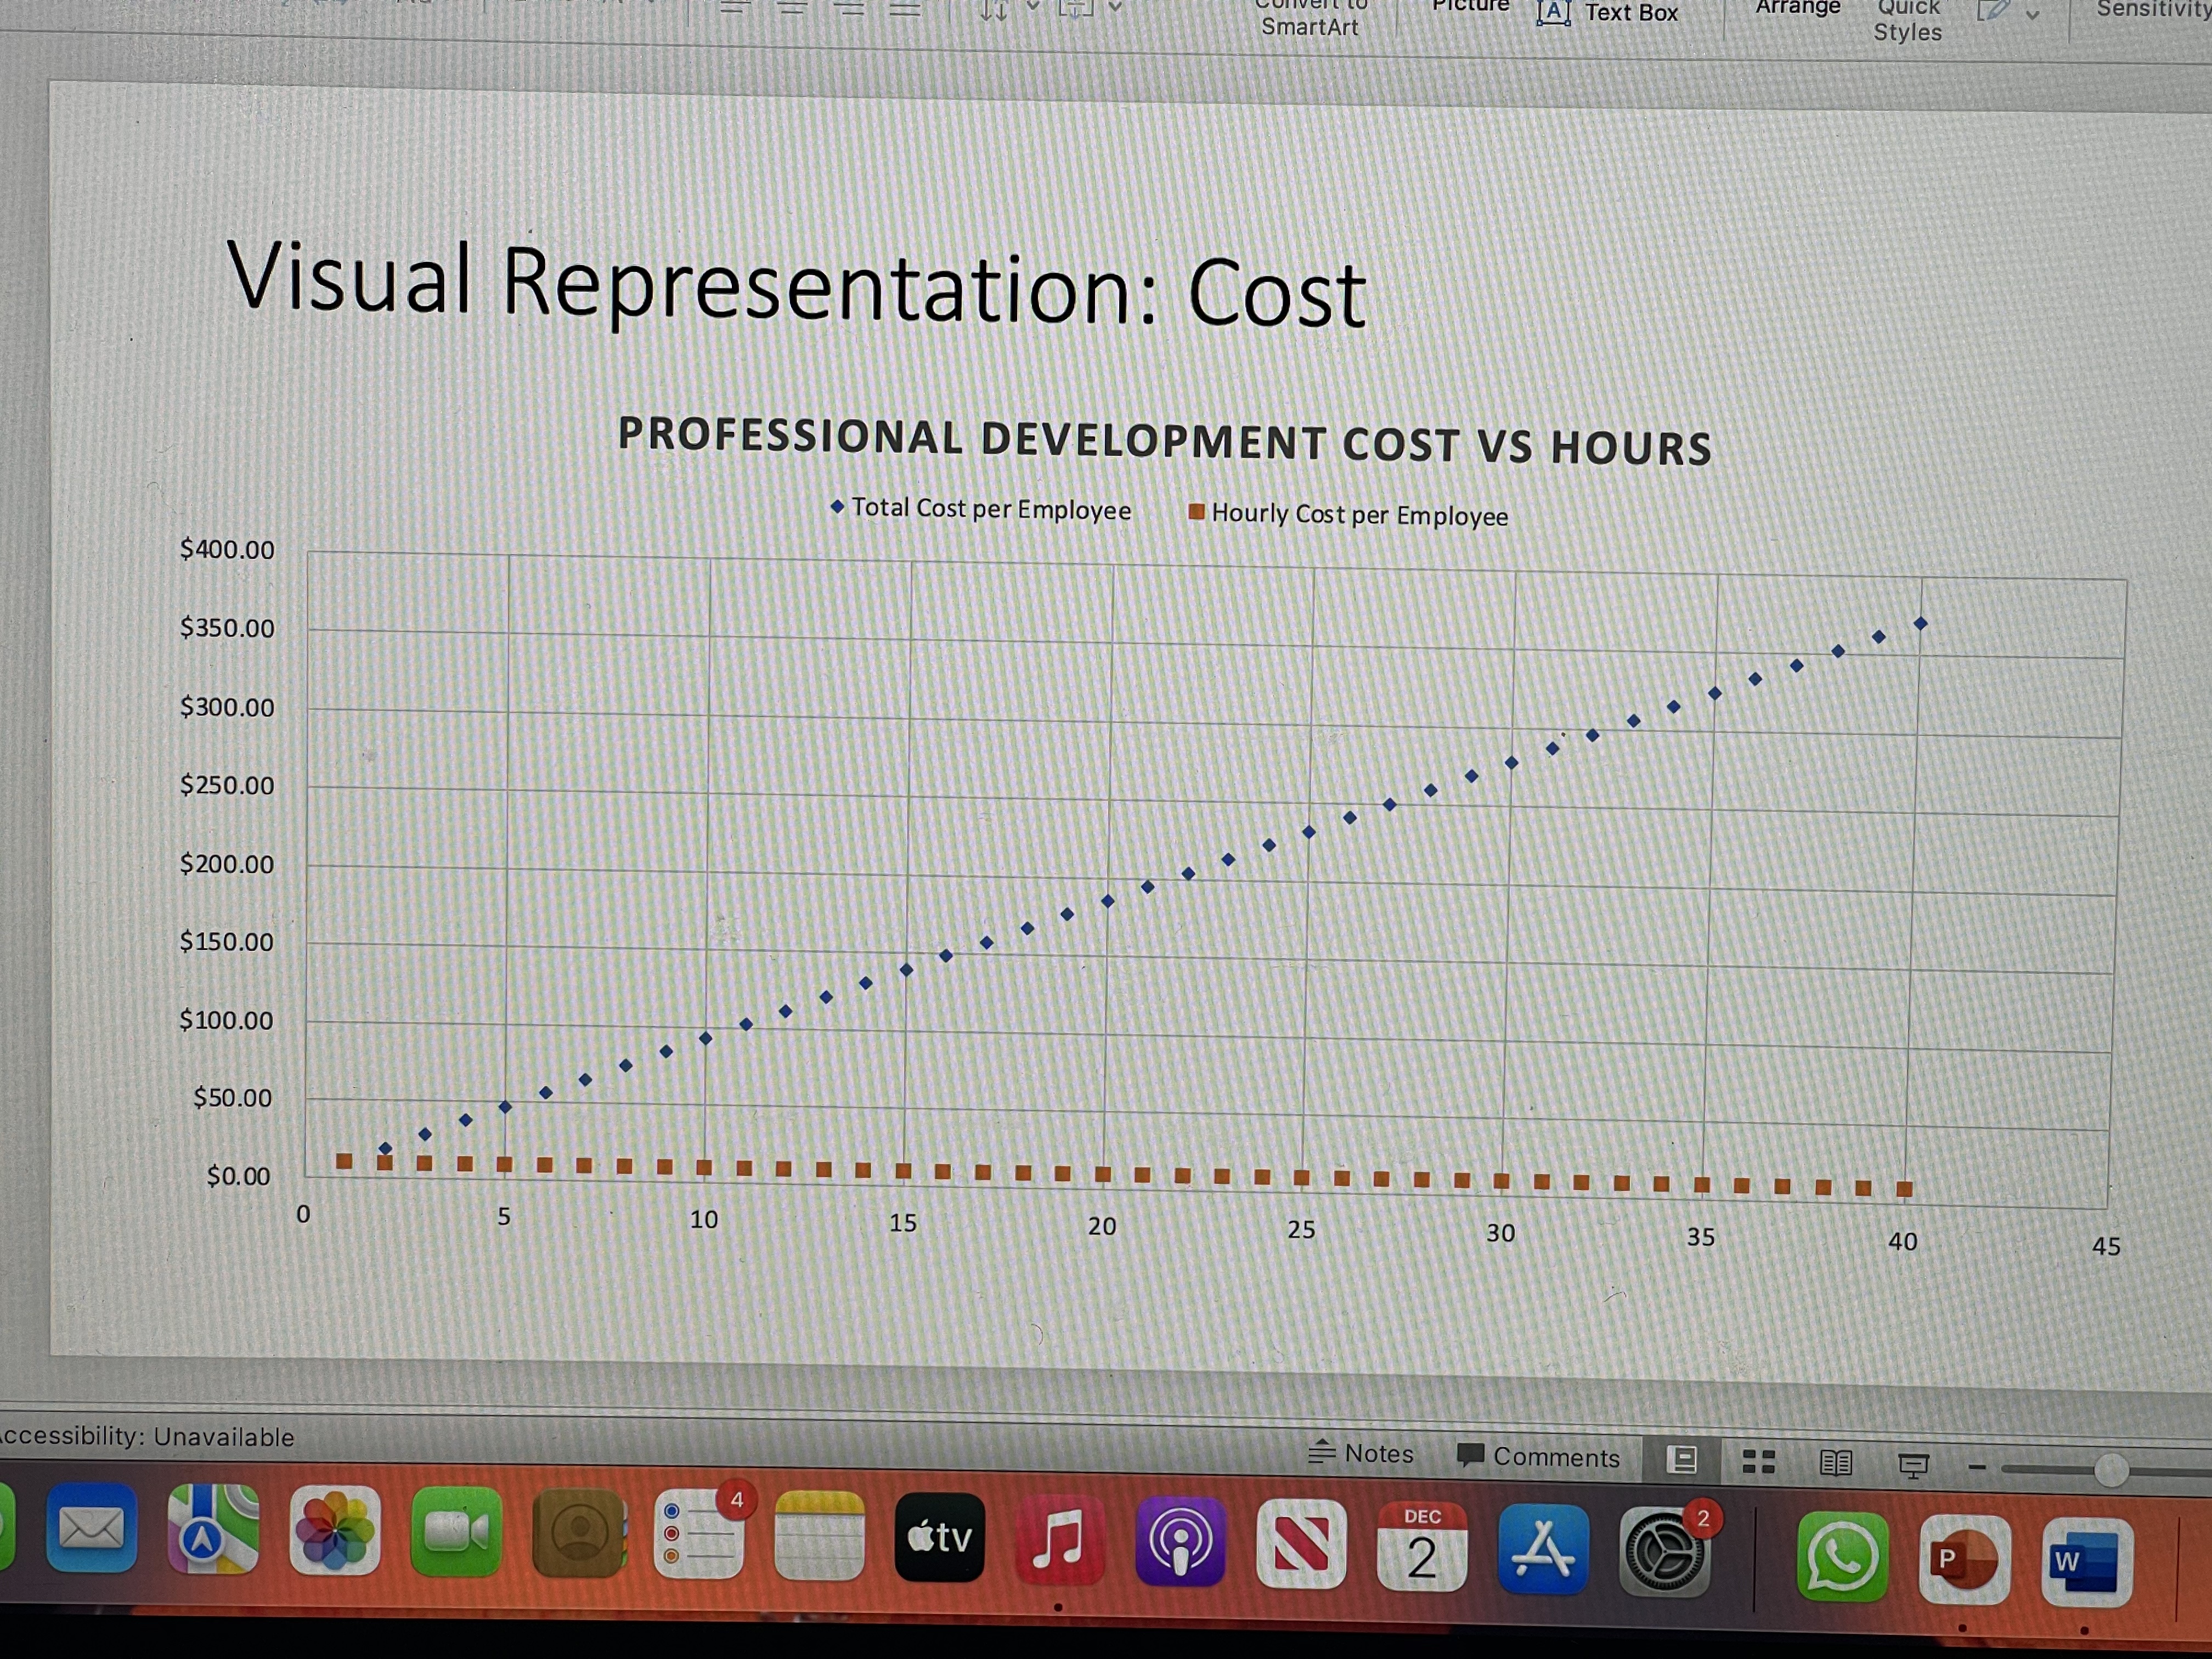
B x x AV ~ Aav A Convert to Picture A Text Box Arrange Quick Sensitivity Des SmartArt Styles Idea Visual Representation: Desirability Survey HISTOGRAM: DESIRABILITY BOX & WISKER: SCORES DESIRABILITY SCORES BY 30 GROUP Survey Score 25 80 70 20 60 50 15 40 30 10 20 10 UT 0 0 Employee Manager [12, 23.6] (23.6, 35.2] (35.2, 46.8] (46.8, 58.4] (58.4, 70] = Notes Comments + Accessibility: Unavailable DEC 2 MA 2 4 P WStyles Visual Representation: Delivery Preference DELIVERY MODE DELIVERY PREFERENCE Hybrid In Person Online Synchronous Asynchrounous 24% 36% 40% 10 20 6 DELIVERY METHOD Synchronous Asynchronous 8 6 32% HYBRID IN PERSON ONLINE 680% Notes Comments 9 + 110 ty: Unavailable DEC 2 istv 2 4 WWk 2: Data Visualization Types Worksheet Write a 50-to 100-word explanation for each box What type of data is reflected in the chart? How do you What does the chart help show you about Data Source the data? know? Survey Cost Modality English (United States) EFocus EO DEC 2 2 4 P MacBook Pro # $ & NO A 6 8 9 WA Text Box Arrange Quick Sensitivity SmartArt Styles Visual Representation: Cost PROFESSIONAL DEVELOPMENT COST VS HOURS . Total Cost per Employee Hourly Cost per Employee $ 400.00 $350.00 $300.00 $ 250.00 $200.00 $ 150.00 $ 100.00 $50.00 $0.00 10 15 20 25 30 35 40 45 ccessibility: Unavailable Notes Comments DEC as tv 2 4 W
Step by Step Solution
There are 3 Steps involved in it

Get step-by-step solutions from verified subject matter experts